The first principle is that you must not fool yourself — and you are the easiest person to fool.
— Richard Feynman, 1974
In most cases, benchmarking is a kind of performance investigation. Benchmarks allow getting new knowledge about software and hardware. This knowledge can be used later for different kinds of performance optimization.
Once you get the desired level of performance, you usually want to keep this level. And you typically don’t want to have situations when someone from your team accidentally spoils your performance improvements. How can we prevent such situations? Well, how do we usually prevent situations when someone spoils our code base? We write tests! If we don’t want to have any performance regressions, we need performance tests! Such tests can be a part of your CI pipeline, so it will be impossible to make any unnoticed performance degradations!1
So, it looks simple: we write performance tests and get profit! Sounds good, doesn’t it? Unfortunately, it’s harder than it sounds. In performance tests, it’s not enough to just measure performance metrics of your code; you also have to know how to process these values. A benchmark without analysis is not a benchmark, it’s just a program that prints some numbers. You always have to explain the benchmark results.
When you run a benchmark locally, you have all the relevant source code under your hands: you can read it, you can play with it. You can do additional actions depending on the current state of the investigation. You can look at the current data and make a decision about the next step. When a benchmark becomes a performance test, you should automate this process. This is much harder because the automation logic should handle future changes to the source code. You don’t know the future, you don’t know the performance metrics that you will get tomorrow, you can’t look at the future distribution plots, and you can’t make nonautomated decisions about future problems. Everything should be automated! And this is a huge challenge: you have to predict possible problems and write algorithms for analysis without knowledge of the data. You should design not only a set of benchmarks, but also a set of performance asserts and alarms that should notify you in case of any problems.
Performance testing goals
What problems do we want to solve? What exactly do we want when we are talking about performance tests? We should clearly understand our goals before the start; we should understand what we want to achieve.
Kinds of benchmarks and performance tests
There are a lot of different kinds of performance tests. You should decide what your test should look like and what exactly it should measure. For example, it can be a stress test that checks what’s going on with your web server under high load. Or it can be a user interface test that checks that UI controls are responsive and work without delays. Or it can be an asymptotic test that verifies that the algorithmic complexity of a method is O(N). Or it can be a functional test that measures the latency of a single operation. Knowledge of these kinds allows you to choose how to write performance tests in each situation.
Performance anomalies
The duration of a test is not a single number; it’s always a distribution. Sometimes, this distribution looks “strange.” For example, it can be multimodal, or it can have an extremely huge variance. We say that distributions of “unusual shape” are performance anomalies. It’s not always a problem, but hunting for performance anomalies can usually help you to find many problems that you can’t find in another way.
Strategies of defense
When should we run our performance tests: before or after the merge into the main branch in a version control system? Should we run performance tests per each commit or it will be enough to run it once per day? How much time should we spend on performance testing and what kind of degradation could we detect in each case? Can we implement completely automatic CI logic? Or do we always have to do things manually? What can we do if a product with performance problems has already been released? There are different strategies of defense from performance degradations: each of them has advantages and disadvantages, and each of them helps you to solve a specific set of problems.
Performance space
For each test, you can collect many metrics. You can measure the total wall-clock time, and you can check out the hardware counters or the number of GC collections. You can collect these metrics only from a single branch or from several branches. There are a lot of ways to get performance numbers, and you should know about them because this knowledge will help you choose which of them will work best for you.
Performance asserts and alarms
Everything is simple with functional tests because they are usually deterministic. If you don’t have tricky race conditions, a test always have the same result. It’s clear when a test is green; depending on your requirements, you can easily check it with a series of assertions.
In the case of performance tests, everything is more complicated. Remember that a test output is a series of numbers; you have new numbers per run even on the same machine. Moreover, in some cases, you have to compare data from different machines. The standard deviation can be huge, so it can be hard or even impossible to detect 5-10% degradation. It’s very important to define your alarm criteria and answer a simple question: “When is a test red?”
Performance-driven development (PDD)
This approach is similar to test-driven development (TDD) with one exception: instead of the usual functional tests, we write performance tests. The idea is simple: you shouldn’t start to optimize anything before you write corresponding performance tests that are red. Indeed, it sounds simple, but it’s a very powerful technique; it will help you to save a lot of time and nerves.
Performance culture
Unfortunately, performance tests will not work well if members of the team don’t care about performance. You need a special kind of culture in your team and your company. Not only is performance testing about technologies; it’s also about attitude.
There is no universal approach that allows getting a performance testing system for free in any project. The best approach for you depends on your performance requirements and on CI/human resources. In this chapter, we will learn basic information about performance tests that will help you to understand which practices can be helpful for your projects and your team.
Many examples in this chapter are based on development stories about IntelliJ IDEA, ReSharper, and Rider. I will mention these projects without additional introductions.
Let’s start with performance testing goals!
Performance Testing Goals
In the modern world, we often release new versions of our software. We are trying to fix old bugs and implement excellent new features. Sometimes, though, these new features do not work as well as expected. However, this is a normal situation: it’s tough to write new code without introducing new problems. That’s just how it works. Hopefully, your users understand this and will wait for a new version with fixes. However, in many cases, it’s almost inexcusable when you’re breaking old features or make them slow. As a performance engineer, the worst user feedback I ever get was like: “The new version of your software works so slowly that I have to roll back to the previous version” or even “I have to switch to the product of your competitors.” Sometimes we have performance degradations—this is the problem that we are going to solve in this chapter. We have defined the problem, and now it’s time to define the goals!
Goal 1: Prevent Performance Degradations
This is our primary goal: prevent performance degradations . Some developers may confuse this goal with “make software fast” or “make users happy with our performance.” Be careful! When we say “prevent performance degradations,” this is not about the overall level of performance or the happiness of our users. “Prevent performance degradations” means that each version of our software should work as fast as or faster than the previous one.
Remark 1. Programming is always about trade-offs; we can’t constantly improve the performance of all features in our program. Sometimes we have to slow down one part because we want to speed up another part (e.g., we spend time on loading caches on startup, which allows fast request processing in the future). This trade-off can be a conscious decision, and it’s completely OK. However, in most cases, developers slow down features accidentally. In large programs, it’s tough to measure performance impact on the whole product even for small changes. Thus, our goal actually sounds like this: prevent accidental performance degradations.
Sometimes even 1% degradation can be a huge problem.
An example: Let’s say we have a web server that processes requests. We host this server in the cloud, and we pay a cloud provider for the time resources at a fixed rate. In our spherical example in a vacuum, each request always takes 100 ms. 1% degradation means that we will get 101 ms per request after a deployment. If we have billions of such requests, the total processing time will increase noticeably.2 The most important thing is that our bills will also increase by 1% .
Sometimes even 500% degradation can be not a problem.
An example: We have a server that displays statistics about user activities. Let’s say that we don’t need real-time statistics; it’s enough to refresh it daily. So, we have a console utility that regenerates a statistic report and deploys it. With the help of cron,3 we run it every day at 02:00 AM. The utility takes 1 minute, so the report is ready at 02:01 AM. A developer from your team decided to implement additional “heavy” calculations: now the report contains new useful information, but the total generation time is 6 minutes; the report is ready at 02:06 AM. Is this a problem? Probably not, because analytics will review the report only in the morning. If the utility takes 10 hours, it can be a problem, but nobody cares about five extra minutes in this case.
Sometimes it’s impossible to talk about degradations in terms of percentages.
An example: Because of a complicated multilevel hierarchical cache, 20% of requests take 100 ms, 35% of requests take 200 ms, and 45% of requests take 300 ms. After some changes, 20% of requests take 225 ms, 35% of requests take 180 ms, and 45% of requests take 260 ms. Is this a good change or a bad change? Do we have a performance regression in this case? (Try to calculate the average processing time for both cases.) Well, this is another trade-off problem: we can’t answer this question without business requirements.
We will discuss different performance degradation criteria in the “Performance Asserts and Alarms” section.
Remark 3. In large software products, it’s very hard to prevent all possible performance degradations. “Prevent all performance degradations” sounds like “prevent all bugs” or “prevent all security vulnerabilities.” Theoretically, it’s possible. In practice, it requires too many resources and too much effort. You can write thousands of performance tests, and you can buy hundreds of CI servers that run these tests all the time. And it will help you to catch most problems in advance, but probably not all of them. Also, some performance degradations may not affect the business goals, so doesn’t always make sense to fix them. Thus, when we say “prevent all performance problems,” we usually mean “prevent most of them that matter.”
Goal 2: Detect Not-Prevented Degradations
Since it’s almost impossible to prevent all performance degradations, we have a second goal: detect not-prevented degradations . In this case, we can fix them and recover the original performance. Such problems can be detected on the same day, in the same week, in the same month, and even one year later. We will discuss what kinds of problem we can detect in different moments in the “Strategies of Defense” section. The most important thing here is that we want to detect these problems before users/customers find them and start to complain about them.
Goal 3: Detect Other Kinds of Performance Anomalies
Degradation is not the only problem we can get. In this chapter, we will discuss so-called “performance anomalies,” which include clustering, huge variance, and other kinds of “strange” performance distributions. Usually (but not always) such anomalies help to detect different kinds of problems in the business logic. If you implement a system for performance analysis, it makes sense to check the performance space for these anomalies as well. One cool thing about it: some anomalies can be detected in a single revision, so you don’t have to analyze the whole performance history or compare commits.
Goal 4: Reduce Type I Error Rate
If you skipped the chapter about statistics (Chapter 4), I will explain this goal in simple terms. A Type I error (false positive result) means that there is no performance degradation, but performance tests detect “fake” problems. Consequences: developers spend some time on investigations in vain. This is not just a waste of our most precious resource (time of developers), it’s also a substantial demotivating factor. Having a few Type I errors per month is OK. Moreover, you should expect to have such errors; it’s too hard to implement an excellent performance testing system with zero Type I error rate. However, if you get several false positive results per day, developers will not care about it. And it sounds reasonable: what’s the point to spend time on useless investigations each day? You can have “real” problems among the “fake” problems, but you will miss them: developers will ignore all alarms because they are likely false alarms. The whole idea is destroyed: performance tests do not benefit and instead distract your team members.
Thus, you should monitor Type I errors. If you have too many of them, it makes sense to reduce performance requirements and weaken the degradation criteria. It’s better to miss a few real problems than to have a completely useless set of performance tests.
Goal 5: Reduce Type II Error Rate
Type II error (false negative result) means that there is performance degradation, but we failed to detect it. Consequences: serious performance problems can be delivered to users with the next update. In this case, we didn’t solve our main problem; we didn’t prevent degradation. Since it’s impossible to prevent all performance degradation, we can try to keep the number of such situations low.
Evaluation of the effectiveness of performance tests
Detection of weaknesses and pieces of code that should be covered by additional performance tests
If you detected many problems in time, it will encourage the team to write new performance tests
If you didn’t have any significant issues (both detected and nondetected), you probably don’t need performance tests for these projects, and it doesn’t make sense to invest time into it in the future.
Goal 6: Automate Everything
It’s not easy to formulate proper degradation criteria and get low Type I and Type II error rates. Sometimes you may be tempted to monitor performance manually instead of writing a reliable system for performance tests. For example, performance tests can produce thousands of numbers that are aggregated and displayed in a monitoring service. Next, you (or one of your colleagues) check performance reports every day, manually look for problems, and notify the rest of the team of the results. This is not a good approach because there are always many problems with the human factor: the person who is responsible for monitoring can be sick, on vacation, or busy. In this case, we will not get any alarms even if we have essential problems. In addition, he or she can miss some dangerous problems due to inattentiveness.
Automatic reports
You can generate a full report about the problem automatically. Such a report could include links to the commits (if you have a web service that allows browsing your code base), a list of authors of these changes, performance history of this test, links to other tests from the same test suite with new performance problems (they can be related), and so on. The main idea here is that the analyst shouldn’t look for additional data; all necessary information should be collected automatically. You can even automatically create an issue in your issue tracker and easily track all performance problems.
Automatic bisecting
It’s not always possible to run all performance tests for each commit. Imagine that one of your daily performance tests is red and there are N=127 commits in this day by ten different people. How do you find the commit that introduces the problem? It’s a good idea to start to bisect these commits. Let’s check the commit 64 (for simplification, assuming that we have a linear history without branches). If the test is red, it means that the problem was introduced before this commit, and we are going to check commit 32. If the test is green, it means that the problem was introduced after this commit, and we are going to check commit 96. If we continue this process, we can find the commit with problem after log2(N) iterations (in the perfect world without branches). Manual bisecting is a waste of developers’ time. This process can also be automated: the report should include the specific commit and the author of this commit (this person should start to investigate the issue).
Automatic snapshots
One of the first steps in such investigations is profiling. Once we get a slow test, we can automatically take a performance snapshot before and after the change. In this case, the analyst can just download both snapshots and compare them. It can allow finding the problem even without the need to download the sources and build it locally: many stupid mistakes can be found only with the snapshots.
Automatic step-by-step analysis
If you have a 1-minute degradation in a huge integration test, you probably have a problem in a single subsystem instead of a project-wide problem. In this case, you can measure separate steps for both cases and compare them automatically. After that, a notification (or an issue) can contain additional information like “it seems that we have a problem with these two steps; the rest of the steps doesn’t have noticeable degradation.”
Automatic continuous profiling
If you have a pool of servers with services that sometimes suffer from accidental performance drops, you can try to profile them automatically. If the overhead of such profiling is too big, you can randomly profile only a part of the pool. For example, pick 10% of the servers and profile them for 30 seconds, then pick another 10%, and so on. You can play with the exact numbers and get a profile snapshot at the moment the problem reproduced (maybe it will not be on the first try). The randomized approach helps to reduce the profiling overhead on your production system.
Try to come up with your ways to automate routine. You should manually do only work that cannot be automated and requires creativity. If a series of performance investigations has common parts, you should try to automate these parts. It allows saving the time of developers and simplifying the investigation process for people who don’t have distinctive performance skills.
Summing Up
Let’s summarize. Our main problem: sometimes we have performance degradations. If we understand what “performance degradation” means well, we can try to prevent accidental performance degradations (Goal 1). Unfortunately, we can’t prevent all of them, so we want to detect not-prevented degradations in time (Goal 2) and detect other kinds of performance problems (Goal 3). We also want to reduce Type I error (false positive: there are no degradations, but we detect “fake” problems) rate (Goal 4) and Type II error (false negative: nondetected degradations) rate (Goal 5). Everything that can be automated should be automated (Goal 6).
Now we know our problems and goals. It’s time to learn what kinds of performance tests we can choose.
Kinds of Benchmarks and Performance Tests
Cold start tests: situations when we care about startup time
Warmed-up tests: situations when an application is already running
Asymptotic tests: tests that try to determine the asymptotic complexity (e.g., O(N) or O(N^2))
Latency and throughput tests: instead of asking “How much time does it take to process N requests?”, we ask “How many requests can we process during a time interval?”
Unit and integration tests: if you already have some usual tests (which are not designed to be performance tests), you can use the raw durations of these tests for performance analysis
Monitoring and telemetry: looking at the production performance in real time
Tests with external dependencies: tests that involve some part of the external world that we can’t control
Other kinds of performance tests: stress/load tests, user interface tests, fuzz tests, and so on
All of these kinds can be applied not only for performance testing but also for regular benchmarking. Let’s start with the cold start tests.
Cold Start Tests
Method cold start
When you run a method for the first time, a lot of time-consuming things may happen on different levels: from JIT compilation and assembly loading on the runtime level to some first-time calculations for static properties on the application logic level.
Feature cold start
Difference between cold and warm time for a method can be negligibly small. However, it can be noticeable when we are talking about thousands of methods and many assemblies. Because of that, a user can experience delays when he or she launches a feature for the first time (especially if this feature involves tons of methods that were not invoked before).
Application cold start
Startup time is important for many kinds of applications. And it’s definitely crucial for desktop and mobile applications. The perfect situation is a situation when the user instantly gets a ready application after a double-click on a shortcut (or launching it any other way). Any delay can make him or her nervous. Imagine a situation when you should quickly make a few edits in a file. You open it in your favorite text editor and… . And you have to wait a few seconds until the text editor is initialized. If you edit files often and close the editor each time, these few seconds can be irritating. For some people, startup time is critical; they might prefer a pure-featured text editor that starts instantly over a full-featured text editor that starts in a few seconds.
OS cold start
If your benchmark interacts with different OS resources, a physical restart can be required for a cold start test.
Fresh OS image
Sometimes it’s not enough to reboot the operating system; we may need a fresh image of the system. The old test runs can make any changes on the disk that can be important for subsequent launches. For example, Rider uses a pool of TeamCity agents for running hundreds of build configurations with tests every day. TeamCity refreshes the agent images once per several days: then the fun begins. Sometimes, we have a significant performance difference between the last (warmed) test run on the old image and the first (cold) test run on the new image (without any changes in the source code base). We don’t use a fresh OS installation each time, because such approach has a huge infrastructure overhead and the described problems are not frequent.
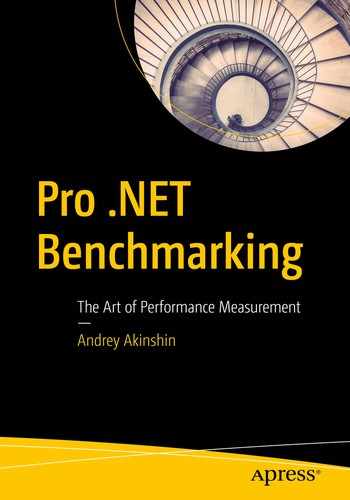
RAMMap shows huge “Standby” memory use for closed file
How is this possible? We closed the player; there are no more applications that use this file. Why do we see it in RAMMap? And what does “Standby” mean?
You can imagine the “Standby” category as a memory cache. After closing the player (which loaded the whole movie file into main memory), there is no need to clear the memory instantly. We can mark this memory as “free” (thus, you will not see it in the Task Manager as a part of “usual” memory) and clear it later when another application asks for additional memory allocation. However, if we decide to watch the movie again, the video player can reuse the file from the “Standby” list. The startup will be faster because we don’t have to load the file into memory again. On the one hand, it’s great: we have better performance for all player launches except the first one. On the other hand, it’s harder to write a performance test or a benchmark for the player cold start. In this specific case, you can manually clear the “Standby” list.5 However, it’s hard to track all the resources that can be reused in the general case and manually clear these resources each time. The system reboot is a universal way to achieve a sterile environment for an honest cold start.
When you run a performance test (or a benchmark) for cold start, you should clearly understand what exactly should be “cold.” In most cases, you have to restart the whole application or even reboot OS before each iteration. This is not always an acceptable way (because each iteration takes too much time), so programmers are looking for other solutions that allow making the environment cold without “heavy” restarts. For example, you can clear OS resources via native API instead of OS restarting or perform each method invocation in a new AppDomain instead of restarting the application.
Warmed Up Tests
It’s always hard to write cold start tests because it’s impossible to run several iterations in a row: you have to restart the whole application (or even the operating system) before each iteration. It’s much easier to write warmed-up tests, and it’s more popular because in many applications (especially for web services), you usually don’t need to care how long startup takes; the performance of a warmed application is more interesting.
However, correct warmed-up tests also require some preparation. The most important thing is the absence of side effects: all iterations must start from the same state. Unfortunately, most of the benchmarks spoil the environment, so the environment has to be recovered. There are several common ways to achieve it.
Such approach can be fine for macrobenchmarks (if we sort tons of elements), but in the case of microbenchmarks (let’s say list.Count < 100), we can get big errors because of these interrupts between stopwatch measurements. In Chapter 2, we discussed that we should use many iterations for microbenchmarks because the Stopwatch resolution is not enough to handle nanosecond operations: if we try to measure the duration of a single ListSortBenchmark call, the ElapsedMilliseconds will have an inaccurate value. In the preceding example, the loop multiplies the error instead of reducing it! Moreover, IterationSetup calls between measurements can produce additional side effects. For example, if this method allocates memory, it can cause a sudden garbage collection during the measurements.
Next, you can get Duration(Run) as Duration(SetupRunCleanup) - Duration(SetupCleanup). This trick is not always successful (especially if Setup and Cleanup allocate many objects and have complex performance distributions), but it usually works for simple cases.
Another factor that can affect the benchmark is the CPU cache. The effect of this cache on the program is simple: the recently read data can be read much faster than data that hasn’t been read by anyone for a long time. In ListSortBenchmark , we should choose the optimal strategy for the CPU cache state. When you sort the array for the first time, CPU loads the list content (or a part of the list in the case of a huge list) into the cache. Next iterations will be faster because we already have the elements (or some of the elements) in the cache. Here we should choose between a cold and a warm state for it. The decision depends on how you are going to use the Sort method in the real application. If you work with elements before sorting, you get a warm list: everything is OK with the benchmark because it also uses the warmed list. If you don’t touch the elements before sorting, you get a cold list in real life. In this case, the benchmark requires cache invalidation in the setup method as well (we will discuss how to do it in Chapter 7).
The approach also has its own problems. Given how those lists are created, there is a high tendency for those objects to live in approximate sequential memory; therefore all the CPU cache pollution is not enough to not skew the results. A better approach for that kind of test is to create all the lists and ensure that the amount of memory used by those is higher by at least 10× the maximum size of the CPU total cache available. Then we should create another list with a random uniform distribution of numbers and iterate over that list to get the indexes. As you are always running the same sequence, the memory effects would be reduced to the index list (therefore diminishing its impact on the benchmark results) and at the same time ensuring a uniform distribution cache pollution. We will discuss more details about this topic in Chapter 8.
We want to know the duration of list.Add .
Actually, we want to gain knowledge of the list.Add duration and use it for solving a real problem (e.g., writing a fast algorithm). The solution of the problem is our “true” goal, but not the knowledge itself. This is important because the correct way to benchmark list.Add depends on how you are going to use it.
We want to add many elements in a list and want to know how much time does it take.
In this case, we probably have to benchmark the addition of N elements instead of a single one. Remember that not all of the Add calls are equal: some of them can produce resizing of the internal array. You can play with the initial state, the initial capacity, the number of elements, and so on. If you want to know the duration of the adding of N elements, you should benchmark this. The performance cost of a single Add is useless for you because you can’t multiply it by N (in the general case) to get the result.
We are going to make a few edits in the Add implementations and check for performance improvements/degradations.
Any performance changes in the Add method will also affect the performance of the Add/RemoveAt pair. It will be hard to say something about how much the edits affect the Add method (quantitative changes), but we can say is it better or worse (qualitative changes). Also, we still have to check cases with the resizing of the internal array carefully.
We are going to use a list as a stack (with Push/Pop operations) with the known maximum capacity and want to know the duration of the “average” operation.
In this case, the Add/RemoveAt benchmark is a great solution because there is no difference between Add and RemoveAt here: we have to measure these methods together.
As you can see, everything depends on the goal. There are many ways to use quick operations like list.Add, but the algorithm performance depends on how you use it. Typically, you can’t get the “reference” operation duration, because this duration depends on the use case. Always ask yourself: why do you want to get knowledge about method performance? How are you going to use this method?6 If you answer these questions first, it will help you to design a good benchmark and decide when you need a cold start test and when you need a warmed-up test (or a combination of the two).
Asymptotic Tests
Sometimes it’s impossible to run all tests on huge data sets. But we can run them on several small data sets and extrapolate the results.
Let’s consider an example. In IntelliJ IDEA, there are a lot of code inspections (as in any IDE). From the user’s point of view, an inspection is a logic that shows a problem with your code (from compilation errors and potential memory leak to unused code and spelling problems). From the developer point of view, an inspection is an algorithm that should be applied to the source code. Different algorithms are independent and don’t affect each other. When IntelliJ IDEA analyzes a file, it applies all inspections to each file. Since there are so many inspections, they should be efficient. Even a single nonoptimal inspection could be a reason for performance problems in the whole IDE.
Well, how should we choose which inspection is “nonoptimal”? There is a simple rule: a proper inspection should have an O(N) complexity where N is the file length. If the inspection complexity is (N^2), we will get a performance problem with huge files.
Portability
Results almost always don’t depend on hardware: we should get the same result on slow and fast computers.
Benchmarks take less time
The inspection performance impact can be noticeable only in huge files. There are hundreds of inspection; we have to wait too long until we benchmark each inspection on each huge file from the test data. The asymptotic approach allows getting reliable results in less time. We can apply an inspection to a few small files, measure the analysis durations, and calculate the asymptotic complexity. Thus, we can check that the the inspection works fast enough without using huge files.
Many iterations
We can’t build a regression model with one or two iterations. We have to run many iterations if we want to build a reliable model that produces correct results.
Complicated implementation
It’s not easy to build a good regression model. If you are lucky enough, your performance function is polynomial. If you are not lucky, the performance function can’t be approximated by an analytic function. Even if the function type is known (and you have only to find the coefficient), it’s not always easy to build such model with a small error.
Thus, asymptotic analysis is not a silver bullet for all kinds of benchmarks, but it can be extremely useful when we want to get measurements for huge input data and we don’t want to wait too long .
Latency and Throughput Tests
(A) “How much time (T) do we need to process N requests?”
The metric here is the latency of processing of N requests (the time interval between the start and end of processing).
(B) “How many requests (N) can we process in the fixed time interval T?”
The metric here is the processing throughput. Such case is also called capacity planning or scalability analysis .
(A) In the first case, N is fixed. Thus, we have to do N iterations and measure the time between start and finish:
// Latencyvar stopwatch = Stopwatch.StartNew();for (int i = 0; i < N; i++)ProcessRequest();stopwatch.Stop();var result = stopwatch.ElapsedMilliseconds;
(B) In the second case, T is fixed. We don’t know how many requests can we process, so we will process requests until the time is over. In real life, it’s typically complicated multithreaded code, but we can write a very simple single-threaded benchmark:
// Throughputvar stopwatch = Stopwatch.StartNew();int N = 0;while (stopwatch.ElapsedMilliseconds < T) {N++;ProcessRequest();}var result = N;
If we have a linear dependency between N and T, there is no difference between these approaches . However, the difference can be huge if the dependency is nonlinear.

T = C · log2(N) Dependency for C=2 and C=4
N | log2 (N ) | T C = 2 | T C = 4 |
|---|---|---|---|
32 | 5 | 10 | 20 |
64 | 6 | 12 | 24 |
128 | 7 | 14 | 28 |
256 | 8 | 16 | 32 |
512 | 9 | 18 | 36 |
1024 | 10 | 20 | 40 |
Imagine that a manager asks you about the performance drop: “How much slower does it work now”? Further, imagine that he or she is not a very good manager and doesn’t want to hear anything about nonlinear dependencies and logarithms7; you should provide a single number as an answer.
(A) Let’s check how much time (T) it takes to process N = 1024 requests. When C = 2, T = 20sec. When C = 4, T = 40sec. The performance drop is 40sec/20sec or 2x.
(B) Let’s check how many requests (N) we can process in T = 20 seconds. When C = 2, N = 1024. When C = 4, N = 32. Performance drop is 1024/32 or 32x.
So, what’s the answer? 2x or 32x? Well, there is not one single correct generic answer. If you want to describe a situation in a general case, you should provide the model (T = C · log2(N) in our case) as an answer. If you want to describe a specific case, you should clearly define the case.
Usually, the target metric depends on your business goals. If the business goal is “Process N = 1024 requests as fast as possible,” you should use the “latency approach” (A). If the business goal is “Process as many requests as possible in T = 20sec,” you should use the “throughput approach” (B). If you have other business goals, you should design a set of benchmarks or performance tests that correspond to your goals. “Correspond” means that you measure the target case and use the correct set of metrics.
If you look at Table 5-1, you may think that capacity planning (the “throughput approach”) is similar to asymptotic analysis. This is not always true. Asymptotic analysis requires several measurements for building the performance model. Capacity planning can be implemented with a single measurement. However, you can use asymptotic analysis for capacity planning: the knowledge of T values for N = 32, … , 1024 allows predicting T for huge N like 2048, 4096, 8192, and so on without actual measurements.
Unit and Integration Tests
Some people are afraid of performance testing because it looks too complicated: they should make a lot of preparation (especially for cold/warm/stress tests), choose correct performance metrics, probably do some tricky math (especially for asymptotic analysis), and so on. I have some good news: if you have “usual” integration tests, you can use them as performance tests! There are many kinds of test classifications. In this book, we will use the term “integration test” for all not-unit tests: functional tests, end-to-end tests, component tests, acceptance tests, API tests, and so on. The main property of such tests that is important for performance testing is duration: the integration tests usually work much longer than instant unit tests. In fact, you can use any of your tests (even “usual” unit tests), which takes a noticeable amount of time (let’s say more than ten milliseconds). If a test takes several microseconds or nanoseconds, we can’t use it “as is” because the natural errors are too big; we have to transform such tests into “true” benchmarks. If a test takes more than ten milliseconds (or even several seconds or minutes, it’s much better), we can try to use it as a performance test without additional modifications.
It may sound strange because we don’t control accuracy for such tests, we don’t do many iterations, we don’t calculate statistics, and we don’t do anything that we usually do in benchmarking. These tests were designed to check the correctness of your program, not performance. It seems that raw duration of unit and integration tests can’t be used in performance analysis.
To me, it sounds strange to have so many performance data and don’t use it. Yes, errors are huge, accuracy is poor, results are unstable, everything is terrible. But this doesn’t mean that we can’t try to use it. In performance tests, every iteration is expensive because it consumes the CI resources and increases our waiting time. From the practical point of view, a good suite of performance tests is always a trade-off between accuracy and the total elapsed time. The unit and integration tests will be executed anyway because we have to check the correctness of the business logic. We will get the duration of these tests anyway without additional effort. It’s also a performance data. Moreover, it’s a performance data that we have for free. If it’s possible to get some useful information from this data (somehow), we should definitely do it!
Explicit performance tests
These tests were designed to evaluate performance. Explicit tests may require special hardware and tricky execution logic (with warm-up, many iterations, metrics calculation, and so on). The result of such test is a conclusion about performance (like “the test works two times slower than before” or “the variance is too huge”).
Implicit performance tests
These tests are “usual” tests that are designed to check logic. Each run of such tests has a duration, its performance number, which we get as a side effect. The result of such a test is a conclusion about correctness (green status for correct logic and red status for incorrect logic). “Implicit performance tests” means that these tests are not designed as performance tests, but we still can use them as such.
“Mixed” performance tests
It may sound obvious, and we will not discuss such tests in detail, but I still have to highlight this idea: you can check logic and performance at the same time. For example, we can write a huge integration stress test that covers the most performance-critical pieces of our code. Such a test can check that everything works correctly even under load (some race conditions can appear in such situations) and that we don’t have a performance regression in such a case.
Persistent CI agent
When we measure performance, it’s a good idea to run performance tests on the same hardware each time. It’s very hard (or sometimes impossible) to evaluate the performance impact of your changes when you compare the “before” performance data from one agent with the “after” data from another agent. It’s always better to have persistent CI agent (or set of agents) for explicit performance tests. This is not mandatory, but it’s highly recommended. In case of implicit performance tests, there is no such requirement8; they should work correctly on any agent.
Virtualization
Virtualization is a great invention that helps us to organize a flexible cloud infrastructure. However, a virtual environment is a poison for the accuracy of explicit performance tests. You never know who else is running benchmarks on the same hardware at the same time. Explicit performance tests usually require a dedicated real (not virtual) agent. Implicit performance tests should work correctly in any environment.9
Number of iterations
Most explicit performance tests require several iterations. Remember that performance of a method is not a single number; it’s a distribution. We can’t evaluate errors and build a confidence interval if we have only one iteration. And we can’t compare two revisions if we don’t know errors and variance. Of course, sometimes a test can be too expensive (it consumes too much time), so you can’t afford to run it several times. Implicit performance tests typically need only one iteration.10
Writing easiness
It’s easy to write implicit performance tests.11 I mean that every method which somehow calls your code can be a test. Different teams have different standards of coding, but most of them agree that the source code should be covered by tests. Some good development practices require writing tests (e.g., before writing a bug fix, you should write a red test for this bug and make it green with your fix). Typically, you get tests as an “artifact” of the development process. You write tests because it will simplify your life in the future and make you more confident in the quality of your code. Most of the unit tests are deterministic: a test is red, or a test is green. Moreover, it’s usually obvious when a test is green. If you are writing a method Mul(x,y) that should multiply two numbers, you know the expected output. Mul(2,3) should be 6. Not 5, not 7; there is only one correct answer: 6. When we are writing explicit performance tests and making performance asserts, it’s always complicated. For example, yesterday Mul took 18 nanoseconds; today it takes 19 nanoseconds. Is it a regression or not? How should we check it? How many iterations do we need? How should we evaluate errors? And the most important question: is the test red or green? If you have clear answers to all questions about performance asserts, ask your teammates about it. Are you sure that you have the same point of view? It’s so hard to write performance tests because there are no strict rules here. You should come up with your own performance asserts that satisfy your performance goal. It’s hard because there is no “absolute green status,” and there is no single “correct” way to write “performance asserts.” There are only trade-offs.
Time of execution
Speaking of trade-offs, the most interesting one is between accuracy and the execution time. Performance tests wouldn’t be so fun if we had unlimited amount of time. I wish I could perform billions of iterations for each of my benchmark or performance tests. Unfortunately, the world is cruel, and we don’t have such opportunities. There is the natural upper limit for the total execution time of a test suite. It can be 10 seconds, 10 minutes, 2 hours, or 5 days: it depends on your workflow. But you have this limit anyway; you can’t spend months and years for a single suite run. It would be great if you could run all of your performance tests during a few hours. If the total time is limited and you have too many tests, you can afford the only small number of iterations. It can be 100 iterations, or 10 iterations, or even a single iteration. And sometimes you have to deal with this single iteration. Implicit performance tests should be as fast as possible, there is no reason (typically) to repeat the same thing over and over. In the case of the explicit performance tests, each additional iteration can increase the accuracy. Of course, there is a “desired” level of accuracy and a “recommended” number of iterations. Usually, it doesn’t make sense to “pay” for additional iterations by execution time after that point.
Variance and errors
Since the explicit performance tests are designed to get reliable performance results, we do everything to stabilize them: use real dedicated hardware, make many iterations, and calculate statistics. In case of the implicit performance tests, we (typically) don’t care about variance and errors: we can run it inside a virtual machine, we can choose a new CI agent each time, we can always do only one iteration, and so on. Variance and errors are typically huge.
Well, does it make any sense to analyze the performance of “usual” tests (a.k.a. implicit performance tests) if it’s so unstable? A general answer: it depends. A more specific answer: you will never know if you don’t try. In the “Performance Anomalies” section later in this chapter, we will discuss many approaches that can be easily applied to implicit performance tests. When you work with a huge code base, it’s impossible to cover all methods by performance tests: you don’t have enough time and resources. However, if someone made a simple mistake (most of the mistakes are simple) and get a huge performance regression (most of the regressions due to simple mistakes are huge), you can easily catch it with your “usual” unit and integration tests (if you use them as implicit performance tests).
Monitoring and Telemetry
Monitoring
Monitoring is a typical solution for web servers: we can watch for life indicators of the server with the help of special tools like Zabbix12 or Nagios.13
Telemetry
Telemetry is a widely used technology in software development14 that allows collecting information on the usage of user applications. Such data is typically anonymous and doesn’t include any sensitive information. However, it can include important information about the performance of different operations. While usual monitoring is a great approach for web services, telemetry is our main “monitoring” tool for desktop applications (however, it can also be useful for the client side of web services). There is an existed API for telemetry by Microsoft,15 but we can implement our own set of tools.
For example, Mozilla Firefox collects data16 about memory usage and operation latencies.
Of course, telemetry can include only general usage data without any performance statistics. For example, .NET Core CLI Tools use17 telemetry for collecting information about .NET Core SDK usage.18 The collected telemetry datasets are open and available for everyone, but they don’t include any information about performance.
Common trends
It’s hard to perform a precise analysis, but you can track common trends. For example, you can compare statistics (like average, p90, p99, and so on) of a web page load duration on the previous week (with the previous version of your web service) and the current week (with an updated web service version). If you see a statistically significant difference, it’s a reason for a performance investigation.
Thresholds
If you have a low latency requirement for some operations, you can introduce thresholds and send telemetry data in cases of failure. Imagine that you develop a desktop application and you want to keep the startup time low. Let’s say that 1 second on modern hardware (you can collect information about the hardware as well) is your upper limit. Of course, a user can have some heavy processes running at the same time, so let’s say that the threshold is 2 seconds. If the startup time is more than 2 seconds, a telemetry alarm should be sent. Probably, you will get a few such alarms every day because you can’t control the user environment. However, if you start getting dozens or hundreds of such alarms after the publishing of a new version, you have an issue for investigation.
Manual watching
It’s hard to predict all the things that can go wrong. It’s even harder to automate the analysis of performance plot and write a system that automatically notifies us about all suspicious things. We will talk about performance anomalies later in this chapter. Thus, it’s a common practice when a special person (or a group of people) are looking for performance charts. Popular services require 24/7 monitoring: in case of any problems (not only performance problems but also availability and business logic issues), the reaction must be immediate. Unfortunately, it’s almost impossible to automate this process. But you can use dashboards and alarm systems to make life easier.
Tests with External Dependencies
External services
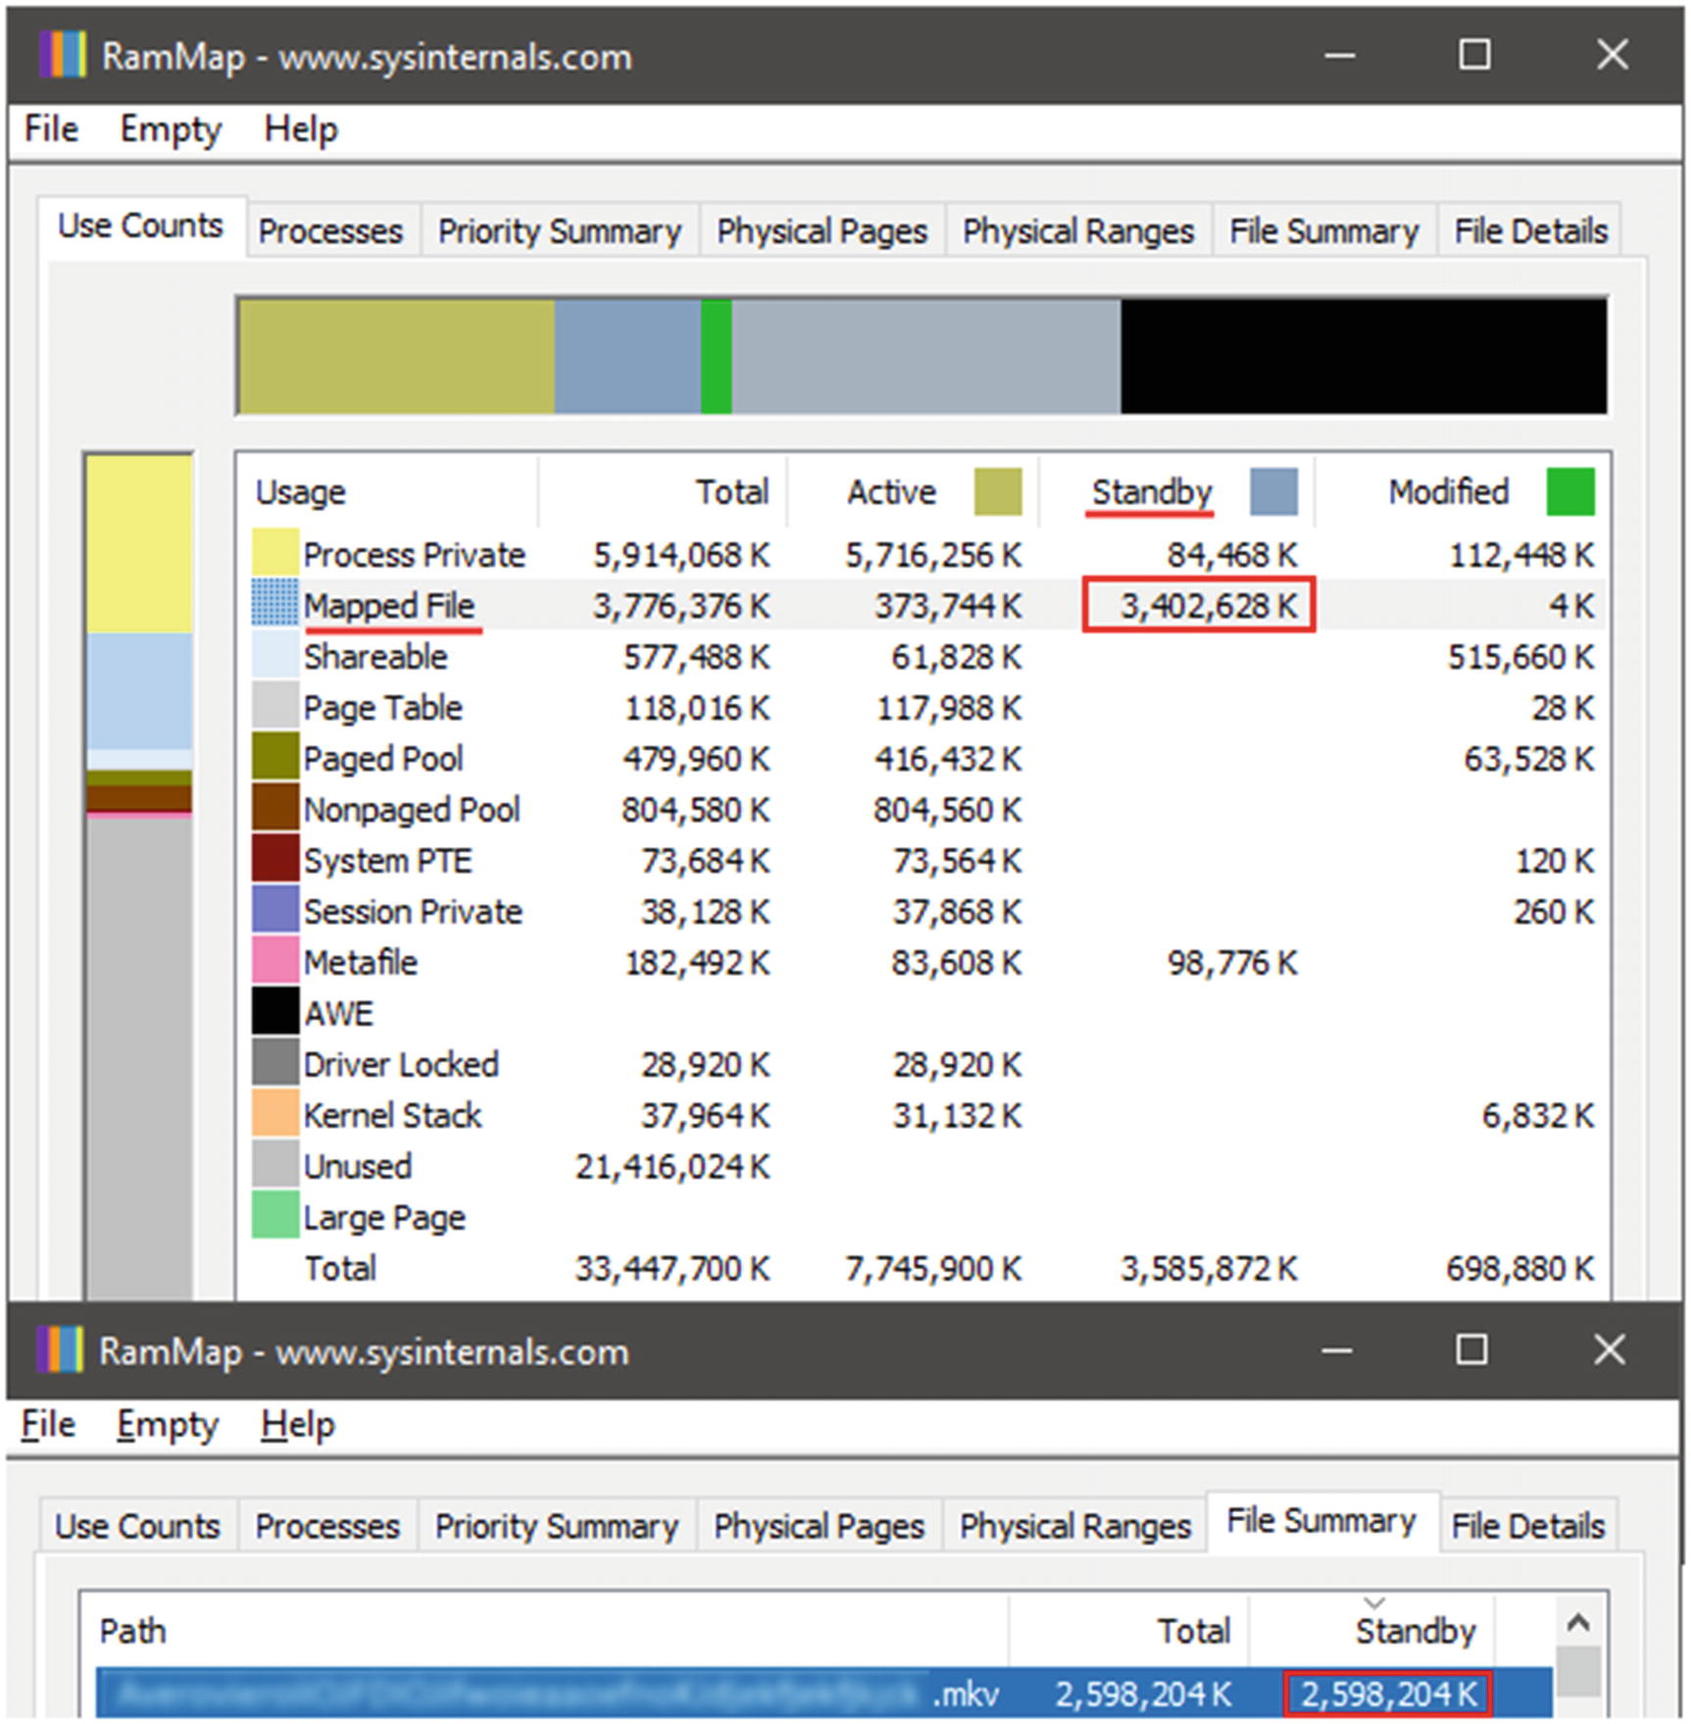
In Rider, we have some tests that cover NuGet features like install, uninstall, or restore. The logic of the test is simple: we just check that we can correctly perform these operations in small and huge solutions. Most of the tests are using our local NuGet repository, but some of them are using the nuget.org and myget.org servers. The primary goal of these tests is checking that the logic is correct, but we can also use it as performance tests. In Figure 5-2, you can see a typical performance plot for one of our NuGet tests. On March 22, 2018, nuget.org was down (see [Kofman 2018]). On April 16, 2018, api.nuget.org was blacklisted in Russia.19 On May 6, 2018, there were some serious problems with search API in the NuGet Gallery (see [Akinshin 2018]). We learn about these incidents immediately because we are watching the performance plots all the time. On the one hand, it’s hard to use such tests for honest performance regression testing: we get false positive results (a performance test is red, but there are no changes in the code base). On the other hand, all these problems are relevant to the behavior that users have in the product. It’s good to be notified about it as soon as possible.
External devices
Many years ago, I was involved in an interesting project. My colleagues and I worked on a program that communicates with OWEN TRM 138.20 This is an industrial measurement device with eight channels that can measure different characteristics, such as temperature, amperage, and voltage. If you connect it to eight different points of a machine detail and measure the temperature at these points, the program can extrapolate the data and build a 2D map of the temperature surface. Everything should work in real time: if the user changes some connection points, the map should be recalculated instantly. The real-time visualization was an important feature, so we checked that the time intervals between changes in the experimental setup and a new visualization. Unfortunately, sometimes we experienced unpredictable delays: OWEN TRM 138 provided data a few seconds late. Thus, it was almost impossible to make reliable performance measurements (because the delays were unpredictable). Eventually, we stopped to measure the whole cycle and started to measure different stages: fetching data, extrapolating, building an image, and so on. It solved the problem because measurements of the device-independent stages were pretty stable.
Performance plot of a NuGet test in Rider
The general advice: if you have some parts of the external world that affect your performance and you can’t control it, try to isolate it. It’s still nice to see the whole picture and get the performance distribution of the whole operations (monitoring/telemetry), but you can’t build reliable performance tests on top of it. For such stages, you should measure test stages that you can control (without any interaction with the external world).
Other Kinds of Performance Tests
There is a huge number of different approaches that can be used for writing performance tests. This section is just an overview of possible techniques; we are not going to cover all of them. However, there are a few more performance test kinds that are worth mentioning: stress/load tests, user interface tests, and fuzz tests.
Stress/load tests
You should always know the limitations of your software product. Usually, it’s a good idea to cover these limitations by performance tests. When we are talking about performance stress tests, we usually mean integration tests. Such testing is especially useful for web services that handle a huge number of users at the same time. A typical mistake for server application benchmarking is focusing only on a situation without load (we send a single request to the server and measure the response time). In real life, you have many users who send requests at the same time. The most interesting thing is that the way the server process these requests depends on the volume of these requests. Fortunately, there are existing solutions that can help to automate this process (e.g., Apache JMeter, Yandex.Tank, Pandora, LoadRunner, Gatling).
User interface tests
It’s not always easy to implement a correct infrastructure for user interface tests, because you usually can’t run it a “headless” mode; you need a “graphical environment” for such tests. For example, in the IntelliJ IDEA code base, there are some user interface tests that check whether the IDE interface is responsive. In the CI pipeline, these tests are running on dedicated agents that are connected to physical 4K monitors.
There are also many libraries and frameworks that can help you to automate testing of the interface in your product (e.g., Selenium).
Fuzz tests
We already know that the performance space is complicated and a method duration can depend on many different factors. Let’s say that there is an algorithm that processes a list of integers and makes some calculations. We implemented a faster version of this algorithm and now we want to verify that it really works faster. How should we compare them? Obviously, we can create a reference set of lists and benchmark both algorithms on each list from the set. Even if the new algorithm shows great results on all these pregenerated lists, we can’t be sure that it will always be faster than the original algorithm. What if there is a corner case that spoils the performance of the new implementation? Unfortunately, we can’t enumerate all possible lists of integers and check each of them. In such cases, we can try a technique called fuzzing. The idea is simple: we should generate random lists until we find input which causes problems. A very simplified version may look as follows:for (int i = 0; i < N; i++){var list = GenerateRandomList();var statistics = RunBenchmark(NewAlgorithm, list);if (HasPerformanceProblem(statistics))ReportAboutProblem(list);}
Fuzzing is a powerful approach used in different areas of software engineering. It can be applied even for searching for bugs in RyuJIT (see [Warren 2018] for details). If we can discover bugs in a JIT compiler that were unnoticed by developers and passed all unit tests, we definitely can try it in benchmarking.
Here is another situation : a user complains about performance problems, you know that these problems most likely relate to specific parameter values, but you don’t know the exact values that cause the problems, and it’s not possible to get information about the user setup. If you are not able to try all possible setups, you can try to find it with the help of fuzzing.
Fuzzing can be also a part of your continuous integration pipeline: you can generate new input data each time and check for unusual performance phenomena.
However, fuzzing has one important drawback. It breaks one of the main benchmark requirements: the repeatability. The fuzz benchmarks are a special kind with only one goal: to catch undesirable results. However, you still should make each run of a fuzz benchmark repeatable by saving the input data or a random seed that is used for data generation.
Summing Up
There are many kinds of benchmarks and performance tests. In this section, we discussed only some of them. To be honest, all kinds of performance tests are not exactly kinds. They are like concepts, ideas, or approaches that you can mix in any combination. For example, you can use asymptotic analysis for capacity planning for a web server in the warmed state under load. Of course, you shouldn’t implement all the discussed test categories in each product: you can select only a few of them or invent your own kinds of performance tests relevant to your problems. The main rule is simple: you should design such tests that correspond to the business goals and take a reasonable amount of time. If you write some benchmarks or performance tests, you should clearly understand what kind of problems are you going to solve. Typically, figuring out the problem takes more than half of the time that goes into finding the solution. Based on this understanding, you can choose the best techniques (or combinations of them) that fit your situation.
Performance Anomalies
In simple words, a performance anomaly is a situation when the performance space looks “strange.” What does this mean? Well, you can choose your own definition. It’s a situation when you look at a performance plot and say: “This plot seems unusual and suspicious; we might have a problem with it. We should investigate it and understand why we have such plot.”
An anomaly is not a problem that should be fixed; it is a characteristic of the performance space that you should know. All anomalies can be divided into two groups: temporal and spatial. A temporal anomaly assumes that you have a history (a set of revisions or commits) that is analyzed. For example, you can find a problem that was introduced by recent changes in the source code. A spatial anomaly can be detected in a single revision. For example, it can be based on a difference between environments or a strange performance distribution of a single test.
Degradation. Something worked quickly before, and now it works slowly.
Acceleration. Something worked slowly before, and now it works quickly.
Temporal clustering. Something suddenly changed for several tests at the same time.
Spatial clustering. Performance results depend on a parameter of the test environment.
Huge duration. A test takes too much time.
Huge variance. The difference between subsequential measurements without any changes is huge.
Huge outliers. The distribution has too many extremely high values.
Multimodal distributions. The distribution has several modes.
False anomalies. A situation when the performance space looks “strange,” but there’s nothing to worry about here.
Each anomaly subsection has a small example with a table that illustrates the problem. After that, we discuss the anomaly in detail and why it’s so important to detect it. Some of the subsections also contain a short classification of the anomaly kinds.
In the last two subsections, we will discuss problems that can be solved by hunting for these anomalies and recommendations about what can you do with performance anomalies.
Let’s start from one of most famous anomalies: the performance degradation.
Degradation
Performance degradation is a situation when a test works slower than before. It’s a temporal anomaly because you detect a degradation by comparing several revisions.
An Example of Degradation
Day | May 17 | May 18 | May 19 | May 20 | May 21 | May 22 |
|---|---|---|---|---|---|---|
Time | 504 ms | 520 ms | 513 ms | 2437 ms | 2542 ms | 2496 ms |
Performance degradation is one of the most common anomalies. When people talk about performance testing, one of the typical goals is to prevent performance degradation. Sometimes it’s the only goal (before people start to explore the performance state and discover exciting things).
Cliff
A cliff degradation is a situation when you have a statistically significant performance drop after a commit. You can see an example of the cliff degradation in Figure 5-3.
Incline
An incline degradation is a situation when you have a series of small performance degradations. Each degradation can’t be easily detected, but you can observe a performance drop when you look at the history for a period. For example, your current performance can be 2 times worse than a month ago, but you can’t point to a commit that ruined everything because there are too many commits with a small performance impact. You can see an example of the incline degradation in Figure 5-4.
Performance anomaly : cliff
Performance anomaly: incline
Of course, it’s not always easy to say whether you have a cliff degradation, an incline degradation, a mix of them, or whether you have a degradation at all. However, the difference between the cliff and the incline is important because it affects when and how you are going to detect a degradation: the cliff can be detected on a specific commit (even before a merge), and the incline can be detected during the retrospective analysis .
Acceleration
Performance acceleration is a situation when a test works faster than before. It’s a temporal anomaly because you detect acceleration by comparing several revisions.
An Example of Acceleration
Day | Apr 05 | Apr 06 | Apr 07 | Apr 08 | Apr 09 | Apr 10 |
|---|---|---|---|---|---|---|
Time | 954 ms | 981 ms | 941 ms | 1 ms | 2 ms | 1 ms |
Expected accelerations
An expected acceleration is a good anomaly. For example, you make an optimization, commit it, and see that many tests work much faster now. There’s nothing to worry about! However, it still makes sense to track such anomalies because of the following reasons:Tracking optimization impact
Even if you are sure that the optimization works, it still makes sense to verify it. Of course, you should perform local checks first, but it’s better to have several verification stages: it reduces the risk that a problem can go unnoticed. Also, you get a better overview of the features that were improved.
Team morale
However, tracking such acceleration can be good for morale in your team. When you implement a feature, you instantly see the result of your work. When you fix performance problems all the time, it can be demoralizing due to lack of feedback.21 People should see a positive impact of their work. A single performance plot with significant performance improvements can make a developer very happy.
Unexpected accelerations
An unexpected acceleration is always suspicious. You can meet a lot of developers who can say something like the following: “I didn’t change anything, but now the software works faster. Hooray!” Unfortunately, an unexpected speedup can often mean a bug. I had observed many situations when a developer accidentally turned off a feature and got a performance improvement. Such situations can pass all the tests, but you can’t hide them from the performance plots! Investigations of unexpected accelerations don’t help you with performance, but they can help you to find some bugs.
Temporal Clustering
Temporal clustering is a situation when several tests have significant performance changes at the same time. It’s a temporal anomaly because you detect it by comparing several revisions.
An Example of Temporal Clustering
Day | Oct 29 | Oct 30 | Oct 31 | Nov 01 | Nov 02 |
|---|---|---|---|---|---|
Test1 | 1.4 sec | 1.3 sec | 1.4 sec | 2.9 sec | 2.8 sec |
Test2 | 4.3 sec | 4.2 sec | 4.4 sec | 8.8 sec | 8.7 sec |
Test3 | 5.3 sec | 5.3 sec | 5.4 sec | 5.4 sec | 5.3 sec |
One of the performance testing goals is automation. A simple “you have a problem somewhere here” is a good thing, but it’s not enough. You should provide all data that can help to investigate the problem quickly and easily.
One of the ways to do it is by tracking the grouped changes. If you get 100 tests with problems after a change, it doesn’t mean that you should create 100 issues in your bug tracker and investigate them independently. It’s most likely that you have a few problems (or only one problem) that affect many tests. Thus, you should find groups of the tests that likely suffer from the same problem.
Suite degradation
Most of the projects have a test hierarchy. You can have several projects in a solution, several test classes in a project, several test methods in a class, and several input parameter sets for a method. When you are looking for performance degradation or another performance anomaly, you should try to highlight test suites22 that share the same problem.
Let’s look at an example in Table 5-5. Here we have two suites: A and B, three tests in each suite. We have some measurements before and after some changes. We have different measurement values for all tests, but some of them can be explained by natural noise. You can note that performance delta in the B suite is not significant: it’s about 1% (typical fluctuations for usual unit tests). Meanwhile, we have a noticeable time increase for tests from the A suite: around 10-18%. The fact that we got a performance degradation for all tests of the suite at the same time is a reason to assume that we have the same problem with the whole suite.Table 5-5.An Example of Suite Degradation
Suite
Test
Time (before)
Time (after)
Delta
A
A1
731 ms
834 ms
103 ms
A
A2
527 ms
623 ms
96 ms
A
A3
812 ms
907 ms
95 ms
B
B1
345 ms
349 ms
4 ms
B
B2
972 ms
966 ms
−6 ms
B
B3
654 ms
657 ms
3 ms
Paired degradation/acceleration
This is another kind of very common problem. In a suite, you often have an initialization logic. It can be an explicit setup or an implicit lazy initialization. In this case, you can have a test that works slowly not because of the test logic, but because it includes the initialization logic. Let’s look at an example in Table 5-6. As you can see, before the change all test methods take about 100 ms except Foo which takes 543 ms. After the change, Foo takes 104 ms (acceleration), Bar takes 560 ms (degradation), and other tests don’t have statistically significant changes. In such cases, we can assume that the order of tests was changed: Foo was the first test in the suite before the changes; after the changes, Bar is the first test. This is not always true, but it’s a hypothesis which should be checked. Why should we care about it? The initialization logic should always move away from the tests to a separate method. It’s not only a good practice, but it’s also important from the performance point of view. A huge deviation from the setup can hide real performance problems in the tests. Let’s do some calculations with rounded example values. If a test takes 100 ms and a setup takes 400 ms, they take 500 ms together. If we have a 30 ms degradation, this comprises 30% of the test time (a significant change) and only 6% of the total time, which can be ignored because of huge errors. If you have a setup logic inside one of the tests, it’s not a bug, but it’s a design flaw. Usually, it’s a good idea to get rid of it (if possible).Table 5-6.An Example of Suite Degradation
Test
Time (before)
Time (after)
Delta
Foo
543 ms
104 ms
-439 ms
Bar
108 ms
560 ms
452 ms
Baz
94 ms
101 ms
7 ms
Qux
103 ms
105 ms
2 ms
Quux
102 ms
99 ms
-3 ms
Quuz
98 ms
96 ms
-2 ms
Correlated changes in time series
If you can detect a correlation between two time series in your tests, it can be interesting to check that you always have this correlation. In Table 5-7, you can see an example of some latency and throughput measurements. The latency is just a raw duration, the throughput is a number of RPS. We run these tests on different agents with different hardware, so we can’t apply “usual” degradation analysis here. However, we can notice a pattern: Throughput≈2 sec / Latency. For example, if Latency = 0.1 sec, we get Throughput = 2 sec / 0.1 sec = 20. This pattern can be explained by parallelization: we have two threads on each agent that process our requests. We can observe such patterns on all agents except Agent4. So, we can assume that something is wrong with parallelization here. Of course, we can detect this problem in other ways. However, the correlation analysis helped us to formulate a hypothesis for future investigation (something is wrong with the Latency/Throughput) and get additional important information (we have this problem only on Agent4). Such facts can save a lot of investigator time because you can collect all such suspicious patterns automatically. You can find another example of such analysis in [AnomalyIo 2017].Table 5-7.An Example of Correlated Changes in Time Series
Day
Agent
Latency
Throughput
Jan 12
Agent1
100 ms
20.12 RPS
Jan 13
Agent1
105 ms
19.01 RPS
Jan 14
Agent2
210 ms
9.48 RPS
Jan 15
Agent2
220 ms
8.98 RPS
Jan 16
Agent3
154 ms
12.89 RPS
Jan 17
Agent3
162 ms
12.41 RPS
Jan 18
Agent4
205 ms
4.95 RPS
Jan 19
Agent4
209 ms
5.02 RPS
Spatial Clustering
Spatial clustering is a situation when the performance of some tests significantly depends on some test or environment parameters. It’s a spatial anomaly because you detect it with a single revision.
An Example of Spatial Clustering
Test1 | Test2 | Test3 | |
|---|---|---|---|
Windows | 5.2 sec | 9.3 sec | 1.2 sec |
Linux | 0.4 sec | 0.6 sec | 1.4 sec |
macOS | 0.4 sec | 0.7 sec | 1.2 sec |
Performance anomaly: spatial clustering
Let’s consider an example . The same version of ReSharper should work on different versions of Visual Studio (VS). For example, ReSharper 2017.3 should work on VS 2010, VS 2012, VS 2013, VS 2015, and VS 2017. The ReSharper team has a suite of integration tests that are executed on all versions of Visual Studio. It’s not a rare situation when some changes spoil performance only on a specific version of Visual Studio. Moreover, if we work only with a single revision (without performance history), we can observe that some tests work fast on VS 2010, VS 2012, VS 2013, and VS 2015 and work slowly on VS 2017. It’s a good practice to look for such situations and try to investigate them.
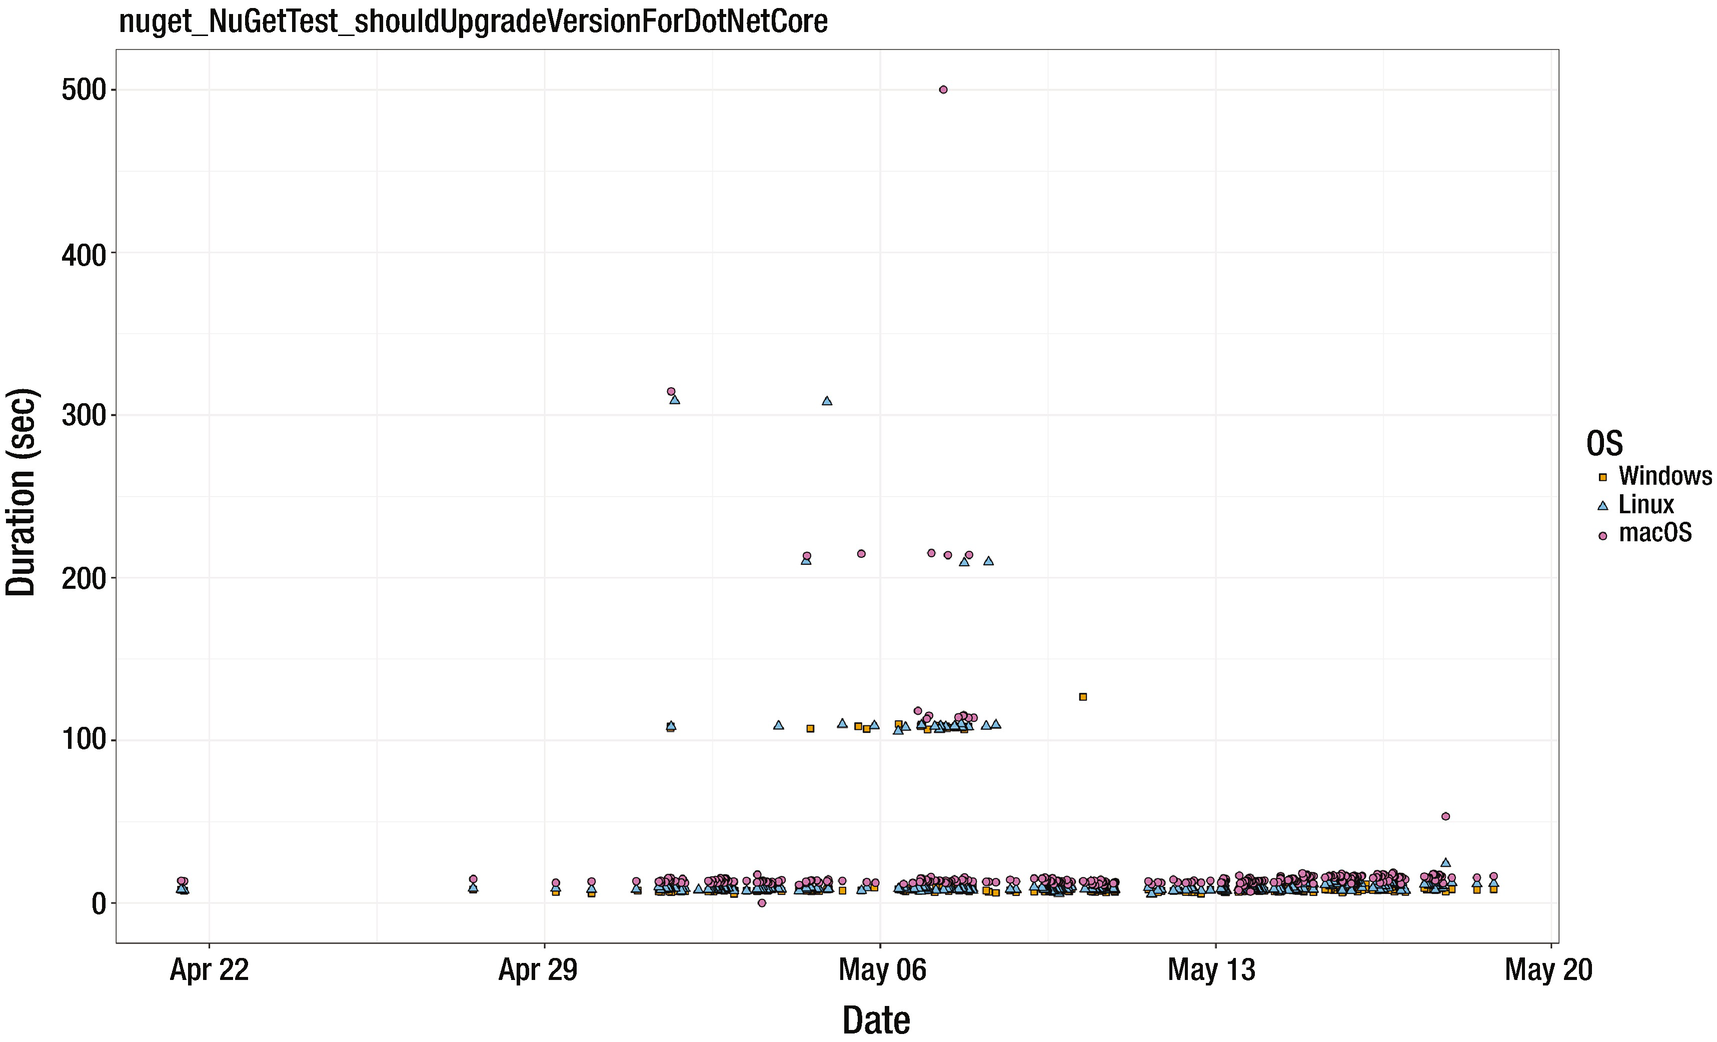
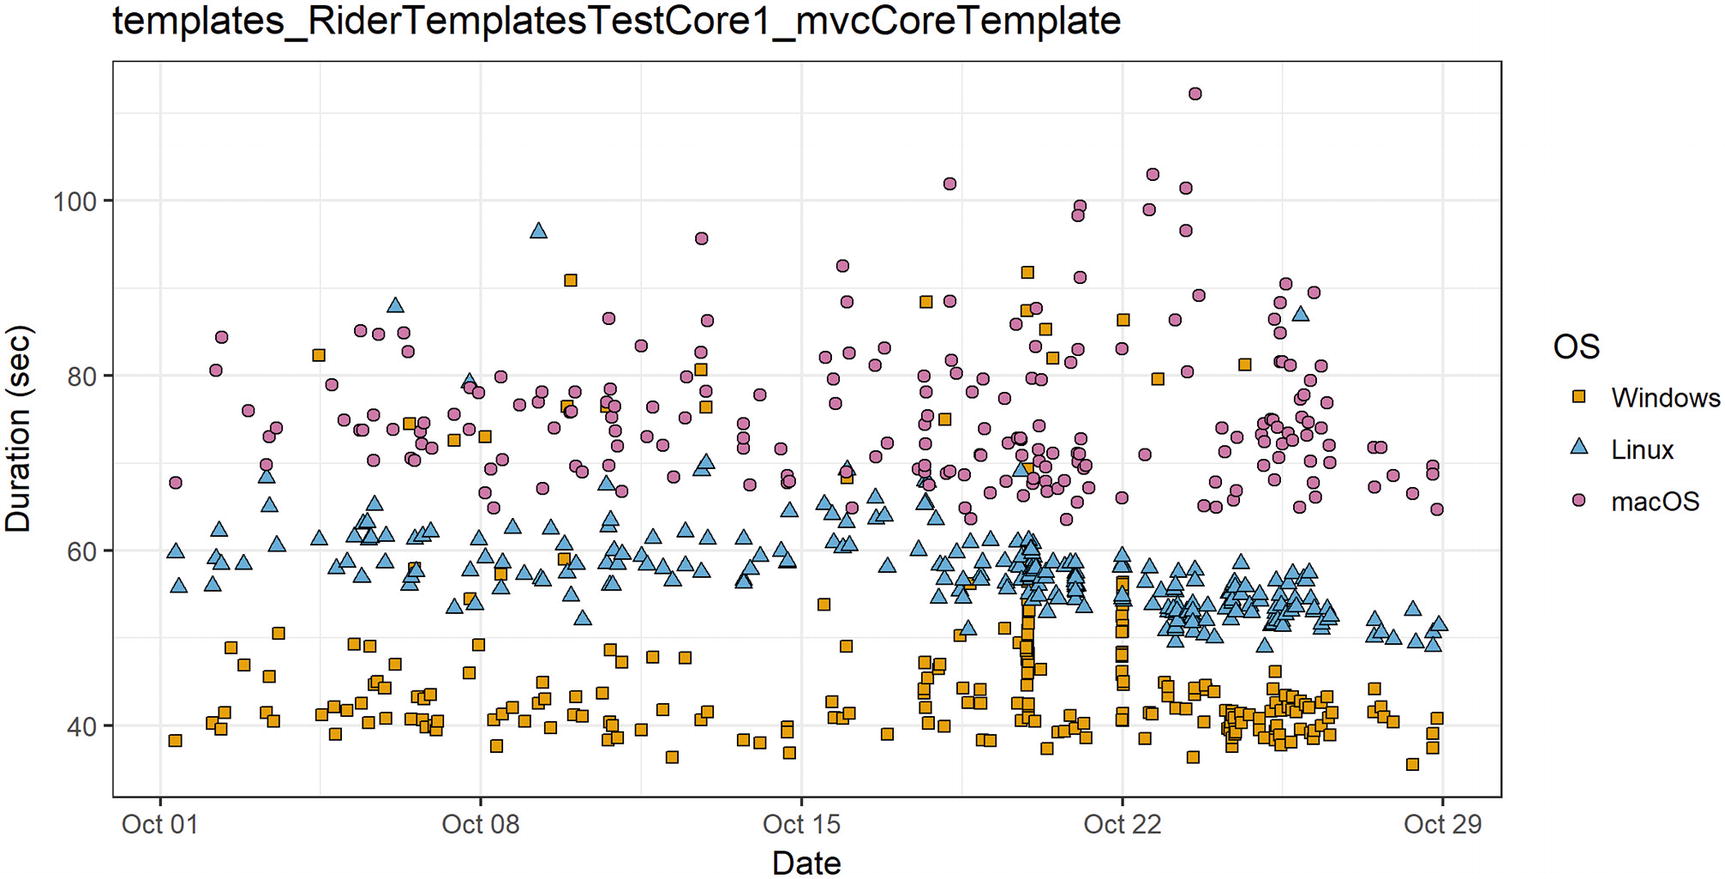
Another example is about Rider. Rider should work fast on all supported operating systems. It uses .NET Framework on Windows and Mono on Linux/macOS. Most of the tests have about the same duration on different operating systems, but some of them demonstrate huge differences. In Figure 5-5, you can see performance measurements for .NET Core ASP.NET MVC template (create a solution from the template, restore NuGet packages, build it, run the analysis, and so on). As you can see in the figure, these tests work faster on Windows than on Linux or macOS. Also, it has a huge variance, but we will discuss it in the next subsection.
The clustering anomaly can be applied to a single revision instead of a set of revisions. It doesn’t show problems which were introduced by recent changes, but it can show problems that you have right now (and had for a long time).
In Chapter 4, we discussed the multiple comparisons problem. This becomes a very serious problem when we are talking about clustering. The more parameters we consider, the more chances we have of finding a “pseudo” clustering. If you include too many parameters in the parameter set (you can include anything from the GCCpuGroup value and free disk space to times of day23 and the moon phase24), you will definitely find a parameter that ostensibly affects the performance. In this case, you can try a popular method of vector quantization from k-means clustering (e.g., see [AnomalyIo 2015]) to neural models and machine learning (some of the cauterization methods were covered in Chapter 4).
Huge Duration
Huge duration is a situation when some tests take too much time. “Too much” can be relative (much more than most of the tests) or absolute (seconds, minutes, or even hours). It’s usually a spatial anomaly because you are looking for the slowest test per revision.
Examples of Huge Duration
Place | Test | Time |
|---|---|---|
1 | Test472 | 18.54 sec |
2 | Test917 | 16.83 sec |
3 | Test124 | 5.62 sec |
4 | Test952 | 0.42 sec |
5 | Test293 | 0.19 sec |
What is the maximum acceptable duration of a single test?
What is the maximum acceptable duration of the whole test suite?
Check out the durations of tests in your project. What is the typical duration of the whole test suite? Find the slowest test (or a group of the slowest tests). Is it possible to test the same thing in less time?
It’s always great when you can run all of your tests quickly. When we are talking about usual unit tests, it’s a typical situation when thousands of tests take a few seconds. However, the situation is worse with integration and performance tests. Sometimes, such tests can take minutes and even hours.
If you are going to speed up the test suite, it doesn’t mean that you should implement some crazy optimizations. There are many examples of success stories when people significantly reduce the total test suite duration by a small change. In [Kondratyuk 2017], a developer changed localhost to 127.0.0.1 and got a 18x speedup of a test suite. In [Songkick 2012], the test suite time was reduced from 15 hours to 15 seconds by a series of different improvements. In [Bragg 2017], the test suite time was reduced from 24 hours to 20 seconds.
Run tests in parallel if possible
If you are care only about the total build time, you should try to run tests in parallel. Be careful: in this case, you will not get reliable performance results. Also, it’s not always possible to run arbitrary tests in parallel because they can work with the same static class or share resources (e.g., files on a disk).
Replace integration tests by unit tests if possibleIf you have a ready framework for integration tests, it’s usually much simpler to write an integration test instead of a unit test. Unit tests require some effort: you have to isolate a part of the system correctly, mock other parts, generate synthetic data, and so on. You typically shouldn’t do it in integration tests: the whole system with real data is ready for your checks. However, if you want to check only a single feature, a unit test is a recommended way. If you run the unit tests before the integration tests, the increased feature covering by additional unit tests can also improve the build time: in case of failed unit tests, you can skip the integration test phase .
Huge Variance
Huge variance is a situation when some tests have too much variance. “Too much” can be relative to other tests (much more than most of the tests), relative to the mean value (e.g., mean = 50 sec, variance = 40 sec), or absolute (seconds, minutes, or even hours). It can be a temporal anomaly (if you analyze a performance history) or a spatial anomaly (if you analyze several iterations for the same revision).
An Example of Huge Variance
InvocationIndex | Time |
|---|---|
1 | 2.34 sec |
2 | 54.73 sec |
3 | 5.15 sec |
4 | 186.94 sec |
5 | 25.70 sec |
6 | 92.52 sec |
7 | 144.41 sec |
Performance anomaly: variance
Huge Outliers
Huge outliers is a situation when the outliers values are too big (much bigger than the mean value) or there are too many outlier values (e.g., significantly more than before). It can be a temporal anomaly (if you analyze a performance history) or a spatial anomaly (if you analyze several test iterations for the same revision).
An Example of Huge Outliers
InvocationIndex | Time |
|---|---|
1 | 100 ms |
2 | 105 ms |
3 | 103 ms |
4 | 1048 ms |
5 | 102 ms |
6 | 97 ms |
It’s a normal situation when you have some outlier values. However, there are expected and unexpected outliers. To be more precise, there is the expected number of outliers. For example, if you do a lot of I/O operations, you will definitely get some outliers, but you will get them with the same rate for the same configurations. Different configurations can have a different number of expected outliers. If you read data from the disk, you will probably get different distributions for Windows+HDD and Linux+SSD. But you usually have the same number for a fixed configuration (for example, 10–15 outliers for 1000 iterations).
Checking the number of outlier values is a powerful technique that helps to detect additional suspicious changes. It’s OK to have outliers , but you should always understand why you have them.
Too many outliers
Sometimes you make some changes (for example, change API for reading data from the disk) and accidentally increase the number of outliers (e.g., 40–50 instead of 10–15). In this case, the standard deviation is also increased, so you have an additional way to detect the problem.
Extremely huge outliers
Outliers are always bigger than the mean value. It’s usually OK if the difference between the maximum outlier and the mean value is huge (e.g., mean = 300 ms, max = 2600 ms). However, sometimes these values are extremely high (e.g., mean = 300 ms, max = 650000 ms). Such a situation can be a sign of a serious bug that can hurt your users .
Multimodal Distributions
Multimodal distribution is a situation when the distribution has several modes (we already covered this topic in Chapter 4). It can be a temporal anomaly (if you analyze a performance history) or a spatial anomaly (if you analyze several iterations for the same revision).
An Example of Multimodal Distribution
InvocationIndex | Time |
|---|---|
1 | 101 ms |
2 | 502 ms |
3 | 504 ms |
4 | 105 ms |
5 | 103 ms |
6 | 510 ms |
7 | 114 ms |

Performance anomaly: bimodal distribution
False Anomalies
False anomaly is a situation that looks like an anomaly but there are no problems behind it. A false anomaly can be temporal (if you analyze a performance history) or spatial (if you analyze only a single revision).
On the performance plot, we will see something that looks like a performance degradation (100 ms ->300 ms), but there is no performance problem here; it’s an expected change of the test duration. If you have a recently introduced anomaly, it’s a good practice to check the changes in the source code first. Found changes in a test body at the beginning of an investigation can save hours of useless work. You can also use a proactive approach and set an agreement in your team: each person who makes any performance-sensitive changes on purpose should mark them somehow. For example, a test can be marked with a special comment or an attribute. Or you can create common storage (a database, a web service, or even a plain text file) that contains all information about such changes. It doesn’t matter which way you choose if all the team members know how to view the history of the intentional performance changes in each test.
If you have an anomaly, it doesn’t always mean that you have a problem. It’s a regular situation to have an anomaly because of some natural reason. If you hunt for anomalies all the time and investigate each of them, it’s important to be aware of “false anomalies” that don’t have any actual problems behind them.
Changes in tests
This is one of the most common false anomalies. If you make any changes in a test (add or remove some logic), it’s obvious that the test duration can be changed. Thus, if you have a performance anomaly like degradation in a test, the first thing that you should check is if there are any changes in the test. The second thing for checking is any changes that spoil the performance on purpose (e.g., you can sacrifice performance for the sake of correctness).
Changes in the test order
The test order can be changed at any moment; there can be several reasons for this, including test renaming. It can be painful if the first test of the suite includes a heavy initialization logic. Let’s say we have five tests in a test fixture with the following order (revision A): Test01, Test02, Test03, Test04, Test05. Our test framework uses lexicographical order to execute tests. In revision B, we rename Test05 to Test00. You can see possible consequences of such renaming in Table 5-13. It’s most likely that we have an example of the “Paired degradation/acceleration” anomaly: now we have a new slow test, Test00, instead of the old slow Test01. We have already discussed that it’s a good idea to move the initialization logic to a separate setup method, but it’s not always possible. If we know about such a “first test effect” and we can’t do anything about it, we will still get a notification about an anomaly here.Table 5-13.Example of Changes in the Test Order
Revision
Index
Name
Time
A
1
Test01
100ms
A
2
Test02
20ms
A
3
Test03
30ms
A
4
Test04
35ms
A
5
Test05
25ms
B
1
Test00
105ms
B
2
Test01
20ms
B
3
Test02
20ms
B
4
Test03
30ms
B
5
Test04
35ms
Changes in CI agent hardware
It’s great if you can run performance tests on the same CI agent (a physical machine) all the time. However, the agent can break down, and it can be hard to find an identical replacement. Any changes in the environment can affect performance: from a minor change in the processor model number to the RAM memory size. It’s always hard to compare measurements from different machines because the actual changes are unpredictable. If you want to perform nanobenchmarks, you typically need a set of identical physical CI agents.
Changes in CI agent software
You can get some trouble with the same agent without hardware replacement. It’s a common practice when admins install operating system updates from time to time. They can be minor security updates or major OS updates (e.g., Ubuntu 16.04 → Ubuntu 18.04). Any environment change can affect performance. This leads to a situation when you see a suspicious degradation or acceleration on performance plots without any changes in the source code.
Changes in CI agent pool
Only the luckiest have an ability to run tests on a CI agent pool with dedicated identical machines. A much more frequent situation is a dynamic pool of CI agents: you can’t predict which hardware/software environment will be used for the next test suite run. Something is constantly changing in such a pool: some machines are turned off, some machines are put into operation, some machines get updates, some machines are occupied by developers who do performance investigations, and so on. Such a situation means increased variance (because of the constant jumping between) and performance anomalies based on the changes in the pool. In Figure 5-8, you can see a performance anomaly for MonoCecil test in Rider for macOS agents around October 20. Nothing was changed in the source code; the degradation was caused by a planned update of all macOS agents. The updating process consumes CPU and disk resources and affects the performance of tests (it wasn’t a special performance test; it was a regular test that runs on regular agents from the pool). As soon as the update finished, the performance returned to the “normal level” (if you can say “normal” for a test with such variance).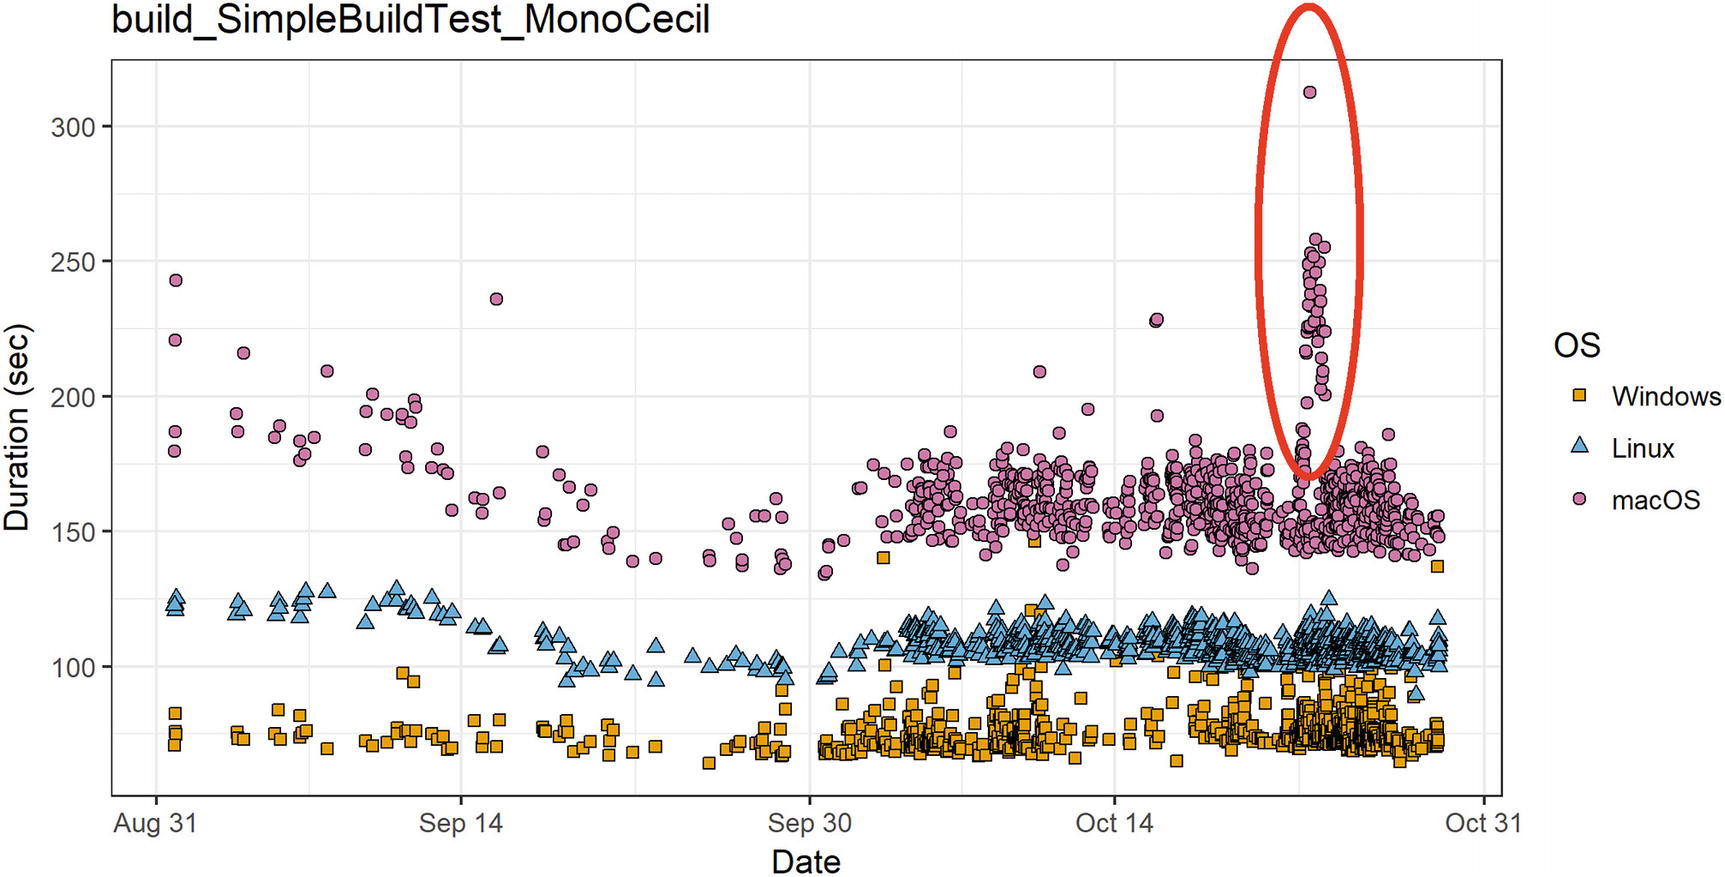 Figure 5-8.
False performance anomaly: agent problems
Changes in the external world
If you have any external dependencies, they can be a persistent source of performance anomalies. Unfortunately, it’s not always possible to get rid of these dependencies. Once a dependency becomes a part of your tested logic, you start to share the performance space with it. The classic example of such a dependency is an external web service. You can download something from the web or test an authentication method. For example, I had such a problem with NuGet Restore tests in Rider. These tests checked that we could restore packages correctly and fast. The first version of these tests used nuget.org as a source feed for all NuGet packages. Unfortunately, these tests were very unstable. Once a day, there was such a situation in which one of the tests was failing because of slow nuget.org responses. On the next iteration, we created a mirror of nuget.org and deployed it on our local server. We (almost) didn’t have fails any more, but the variance was still huge for these tests. On the final iteration, we started to use a local package source (all the packages were downloaded on the disk before the test suite is started). We got (almost) stable tests with low variance. It should be noted that it’s not an honest test refactoring. We sacrificed a part of the logic (downloading packages from a remote server) for the sake of the false anomaly rate.
Any other changes
Our world is constantly changing. Anything can happen at any minute. You should always be ready to meet false performance anomalies. A performance engineer who is responsible for the processing of the anomalies should know what kinds of false anomalies are frequent for the project infrastructure. Checking if an anomaly is false should be the first thing that you should do before a performance investigation. This simple check helps to save time and prevent a situation in which a false anomaly becomes a Type I (false positive) error.
Underlying Problems and Recommendations
Performance degradation
It may sound obvious, but the biggest problem with this anomaly is the degradation of the performance. Usually, people start to do performance testing because they want to prevent degradations.
Hidden bugs
Missed asserts are bugs in tests, but you can have similar bugs in the production code. If a test has a huge variance, the first thing that you should ask is the following: “why do we have such variance here?” In most cases, you have a nondeterministic bug behind it. For example, it can be a race condition or a deadlock (with termination on timeout but without assert).
Slow build process
You have to wait too long before all tests are passed on a CI server. It’s a typical requirement that all tests should pass before an installer will be available, or a web service will be deployed. When the whole test suite takes 30 minutes or even 1 hour to run, it’s acceptable. However, if it takes many hours, it slows down your development process.
Slow development process
If a test is red and you are trying to fix it, you have to run the test locally again and again after each fix attempt. If a test takes 1 hour, you have only eight attempts with a standard 8-hour working day. Moreover, it doesn’t make any sense to wait for the test result without any actions, so developers often switch to another problem. The developer context switch is always painful. Also, the huge test duration implies huge errors. When a test takes 1 hour, you are usually OK with an error of a few minutes. In such a situation, it’s hard to set up strict performance asserts (we will talk about this later).
Unpredictably huge duration
We already talked about a huge test duration: this is not a good thing. When you have an unpredictably huge test duration, it’s much worse. In such case, it’s hard to work on the performance of such tests. If you have timeouts (which are popular solutions because tests may hang), the test can be flaky because the total duration can sometimes exceed the timeout.
It’s hard to specify performance asserts
Let’s look again at Figure 5-6. You can see a performance history plot of a concurrency test from the IntelliJ IDEA test suite. Some of the runs can take 100 seconds (especially on Windows), and others can take 4000 seconds (especially on macOS). We can observe both kinds of values on the same revision without any changes. Imagine that you introduce a performance degradation. How do you catch it? Even if you have a performance degradation of 1000 seconds, you can miss it because the variance is too huge.
Missed asserts
Many times, I have seen tests with green performance history as follows: 12.6 sec, 15.4 sec, 300.0 sec, 14.3 sec, 300.0 sec, 16.1 sec, … . A typical example: we send a request and wait for a response. The waiting timeout is 5 minutes, but there is no assert that we got the response. After 5 minutes, we just terminate waiting and finish the test with the green status. It may sound like a stupid bug, but there are a lot of such bugs in real life. Such tests can be easily detected if we look for the tests with extremely high outliers.
Surprising delays in production
Have you ever had a situation when you do an operation that is usually performed instantly, but it hangs an application for a few seconds? Such situations are always annoying users. There are many different reasons for such behavior. Usually, it’s hard to fix them because you typically don’t have a stable repro. However, some of them can also be a cause of outliers on your performance plot. If you systematically have outliers on a CI server, you can add some logs, find the problem, and fix it.
Hacks in test logic
Have you ever had flaky tests with race conditions? What is the best way to fix such tests? There is an incorrect but popular hotfix: putting Thread.Sleep here and there. Usually, it fixes the flakiness; the test is always green again. However, it fixes only symptoms of a problem, but not the problem. Once such fix is committed, it’s hard to reproduce this problem again. And it’s hard to find tests with such “smart fixes.”25 Fortunately, such hacks can be seen with the naked eye on the performance plots. Any Thread.Sleep calls or other hacks that prevent race conditions or similar problems can’t be hidden from a good performance engineer.
False anomalies
The main problem with a false anomaly is obvious: you spend time on investigations, but you do not get a useful result.
Systematic monitoring
This is the most important recommendation: you should monitor performance anomalies all the time. Since, a real application can have hundreds of them, you can use the dashboard-oriented approach: for each anomaly, we can sort all tests by the corresponding metrics and look at the top. Look at the tests with the highest duration, the highest variance, the highest outliers, the highest modal values, and so on. Try to understand why you have these anomalies. Do you have any problems behind them? Could you fix these problems? You can look at such a dashboard one time at month, but it will be much better if you will do it every day: in this case you can track new anomalies as soon as they are introduced.
Serious anomalies should be investigated
If you systematically track anomalies, you can find a lot of serious problems in your code. Sometimes, you can find performance problems that are not covered by performance tests. Sometimes, you can find problems in business logic that are not covered by functional or unit tests. Sometimes, it turns out that there are not any problems: an anomaly can be a false anomaly or a natural anomaly (which is caused by “natural” factors you can’t control like network performance). If you don’t know why you have a particular anomaly, it’s a good practice to investigate it. If you can’t do it right now, you can create an issue in your bug tracker or add the anomaly to a “performance investigation list.” If you ignore found anomalies, you can miss some serious problems, which will be discovered only in the production stage.
Beware of high false anomaly rates
If the Type I (false positive) error rate is huge, the anomaly tracking system becomes untrustable and valueless. It’s better to miss a few real issues and increase the Type II (false negative) error rate than overload the team with false alarms, which can undo all your performance efforts. If you see a performance anomaly, the first thing that you should do is check for natural reasons. Typically, these checks don’t take too much time, but they can protect you from useless investigations. Here are a few check examples:Check for changes in test
If somebody changed the source code of the test in a corresponding revision, check these changes.
Check for changes in test order
Just compare test orders for the current revision and for the previous one.
Check the CI agent history
Did you use the same agent for the current and previous results? Did you make any changes in the agent hardware/software?
Check typical sources of false anomalies
If you are looking for performance anomalies all the time, you probably know the most common causes of false anomalies. Let’s say you download content from an external server with 95% uptime. If the server is down, you are doing retries until the server is up again. Such behavior can be a frequent source of outliers without any changes. If you know that a group of tests suffer from such phenomena, the first thing that you should check is log messages about retries.
Beware of alert fatigue
It’s great when you can track down all your performance problems. However, you should understand how many issues can be handled by your team. If there are too many performance anomalies in the queue, the investigation process becomes an endless and boring activity. You can’t fix performance issues all the time: you also have to develop new features and fix bugs.
Summing Up
There are too many kinds of performance anomalies to fully discuss here. Most of them can be easily detected with the help of very simple checks. You don’t typically need advanced techniques because the basic anomaly checkers catch most of the problems. In Rider, we usually look only at the “Huge variance” and “Clustering” anomalies. The first implementation of our "performance analyzer" took about 4 hours: it was a C# program that downloads data from a TeamCity server with an R script, which aggregates this data and draws a performance plot for the most suspicious tests. In those days, I created a few dozen performance investigation issues for different people. Many of them were real problems that were hidden among thousands of unit tests. And to this day, we continue to find important problems every week. We also have many advanced analyzers that look for tricky performance issues. However, basic “Huge variance” and “Clustering” supply us with a huge list of problems to be investigated.
I believe that checking for performance anomalies is a healthy thing for any huge project that requires performance tests. It helps to detect critical problems in time before users start to suffer after the next software update. Each project is unique, with its own set of performance anomalies. Everything depends on your domain area. You can find many interesting examples of different projects on the Internet. I recommend that you read about flow anomalies in distributed systems (see [Chua 2014]), anomalies in correlated time series (see [AnomalyIo 2017]), and other methods of performance anomaly analysis in different cases (see [Ibidunmoye 2016], [Dimopoulos 2017], [Peiris 2014]).
There is no universal way to write analyzers that will work great for every project. Knowledge of the main performance anomalies allows you to check the performance history of your test suite and write analyzers that will work great for your program.
Strategies of Defense
There are several ways to prevent or detect performance degradation. In this section, we talk about some common ways to do this.
Precommit tests: looking for performance problems before a merge into the master branch.
Daily tests: looking for performance problems in the recent history.
Retrospective analysis: looking for performance problems in the whole history.
Checkpoint testing: looking for performance problems in special moments of the development life cycle.
Prerelease testing: looking for performance problems just before a release.
Manual testing: looking for performance problems manually.
Postrelease telemetry and monitoring: looking for performance problems after a release.
I call these approaches “Strategies of defense against performance problems,” but this not a well-known term, and other terms may also be used. For example, Joe Duffy calls them “test rings” in [Duffy 2016].
Detection time: when can a performance degradation be detected?
Analysis duration: how much time does it take to detect a problem?
Degree of degradation: what kind of degradation can be detected? Is it huge (50-100% or more), medium (5-10%), or small (less than 1%)?26
Process: automatic, semiautomatic, or manual? What should the developers do in each case and how can it be automated?
Pre-Commit Tests
Detection time: on time.
The best thing about this approach is simple: we detect all performance degradations in advance automatically. There is no need to solve any new performance problems because we don’t have any of those (in theory, of course).
Analysis duration: short.
Since we won’t wait too long before our changes will be merged, the precommit tests should work quickly. It’s great if a typical precommit test suite run doesn’t take more than a few hours.
Degree of degradation: huge.
Of course, there are some limitations. We don’t have any possibility of doing a lot of iterations (because we have to run all the tests very quickly). Thus, we can catch only huge degradations (e.g., 50% or 100%); it’s almost impossible to detect small degradations (e.g., 5% or 10%). If we try to do this, it will increase the total run duration or Type I (false positive) error rate.
Process: automatic.
I just want to repeat one of my favorite parts about this way: it’s completely automatic, meaning that no human actions are required.
Daily Tests
Detection time: 1 day late.
With daily tests, we detect performance degradations when they are already in master.
Analysis duration: up to 1 day.
Daily tests don’t have “a few hours run” limitation; we can use up to 24 hours. If that’s not enough, we can try weekly tests and spend up to 7 days per a test suit.
Degree of degradation: medium.
Since we have a lot of time, we can do many iterations and detect medium performance degradation (like 5% or 10%).
Process: semiautomatic.
Daily tests should be a part of your CI pipeline; the build server should run them every day automatically. However, if some tests are red (we have a performance degradation), the incident should be investigated manually. Typically there are a few team members who monitor the status of daily tests all the time and notify a team in case of any trouble .
Retrospective Analysis
Detection time: late.
Unfortunately, some degradations will be detected late (probably after a week or after a month). However, it’s better to detect such cases after a month inside the team than to let customers detect them after a few months.
Analysis duration: it depends.
We don’t have any duration limitations; we can spend as much time as we want. If we don’t have enough historical data, we can even take specific commits, build them, and run some additional iterations. Everything is possible in the retrospective analysis!
Degree of degradation: small.
We can detect any kind of performance degradations (even less than 1%)! In fact, the main limitation here is how much we are ready to allocate in terms of resources.
Process: semiautomatic.
The same situation as in the case of daily tests: we can run retrospective analysis automatically, but all issues found should be investigated manually.
Checkpoints Testing
Detection time: on time.
This approach allows preventing performance degradations before they will be merged into master.
Analysis duration: it depends.
In fact, the merge deadline is our only limitation. We can do as many tests as we want before we are sure that it’s safe to merge it.
Degree of degradation: small.
Since we have a lot of time, we also can do a ridiculous number of iterations, and find even very small degradations.
Process: almost completely manual.
It’s the developer’s responsibility to check dangerous changes; it’s not possible to automate this. If you suspect that you can have some performance problems in your branch, you should run tests manually. If you find any problems, you should investigate them manually. There is no automation here (except for running tests and branch comparison) .
Pre-Release Testing
Detection time: very late.
Usually, developers run prerelease performance tests before the release. And they hope that there are not any problems; it’s an additional check just to be sure. However, if you discover a serious performance problem a few days before the release, it can be a huge problem (especially if you have strict deadlines).
Analysis duration: it depends.
Well, it’s up to you: it depends on your release cycle. How much time do you typically have between the release candidate and the actual release? Some teams spend only a few days for the final stage of testing, while others spend months. You should find an acceptable trade-off between how fast you want to deliver your product and how critical performance degradation can be.
Degree of degradation: it depends.
It depends on the duration of analysis. The rule is simple: the more time you spend, the more minor degradations can be found.
Process: almost completely manual.
The same situation as in the usual checkpoint case. You should manually run tests before release, and you should manually check the report and investigate all the issues.
Manual Testing
Detection time: late.
This approach allows checking changes that are already merged. Typically, the manual testing is a part of your workflow: you can check your daily builds,30 you can check some internal milestone builds, you can check “checkpoints,” you can check preview versions, and you have to check the release candidate.
Analysis duration: it depends.
It always takes too much time. The exact number of spent hours depends on the target product quality and capabilities of the QA team.
Degree of degradation: huge.
Usually, manual testing allows detecting only huge performance degradations because it’s hard to detect a small performance regression with the human eye.
Process: completely manual.
You start to test software manually, you test it manually, and you investigate it manually. There is no automation here.
Post-Release Telemetry and Monitoring
Detection time: too late for the current release, but not too late for the next one.
It’s never too late to fix performance problems. It’s bad if you missed some problems in the current release, but it’s much worse if you do nothing about it. You will always get “it works too slowly” feedback from your users or customers. It’s very important to collect all performance issues from each release. There are several ways to do it:Monitoring
In case of a web service, you can monitor performance metrics of your servers in real time. You can manually compare them with expected metrics or set up automatic alarms about performance problems.
Telemetry
If you can’t monitor your software (desktop programs, mobile applications, embedded systems, the client side of a web page, and so on), you can collect telemetry data and regularly process it.
Issue tracker
If you have an issue tracker, group all performance-related issues with the help of tags or issue fields.
New tests
It’s almost impossible to cover all use cases by performance tests. Never stop writing tests! If you continue to write new tests, you probably will discover new problems.
Analysis duration, Degree of degradation, Process: it depends.
It’s up to you how you collect, analyze, and process performance issues after a release.
Summing Up
Overview of Strategies of Defense
Strategy | Detection time | Analysis duration | DoD | Process |
|---|---|---|---|---|
Precommit tests | On time | Short | Huge | Automatic |
Daily tests | 1 day late | Up to 1 day | Medium | Semiautomatic |
Retrospective analysis | Late | It depends | Small | Semiautomatic |
Checkpoint testing | On time | It depends | Small | Almost completely Manual |
Prerelease testing | Very late | It depends | It depends | Almost completely Manual |
Manual testing | Late | It depends | Huge | Completely manual |
Postrelease T&M | Too late | It depends | It depends | It depends |
Each approach has its advantages and disadvantages. It’s up to you how to test your software. If you care about performance a lot, it makes sense to use several approaches (or all of them) or their combination. Of course, we didn’t cover all possible options for performance testing; we just discussed some main directions. You can come up with an approach that will be the best for your own situationr.
Performance Subpaces
Metric subspace : what do we measure: wall-clock time, asymptotic complexity, hardware counter values, or something else?
Iteration subspace : how many iterations do we do?
Test subspace : how many tests do we analyze in the same suite?
Environment subspace : how many different environments do we use?
Parameter subspace : what parameter values do we use?
History subspace : are we working with a single branch or looking at the whole repository?
Let’s discuss each subspace in detail.
Metric Subspace
Wall-clock time
This is an honest test duration. It can be measured via Stopwatch or be fetched from a CI server.
Throughput
How many operations can we process per second?
Asymptotic complexity
What is the asymptotic complexity of your algorithm? O(N)? O(N*log(N))? O(N^3)?
Hardware counters
There are plenty of them. You can use “general” counters for all cases (e.g., “Retired Instructions”) or “specific” counters for specific tests (e.g., “Branch mispredict rate” or “L2 Cache Misses”). We will talk about hardware counters in detail in Chapter 7.
I/O metrics
You can collect all the metrics provided by OS for network and disk operations. It often helps to locate a real bottleneck correctly.
GC.CollectionCount
This is one of my favorite metrics. One of the main problems with “time” and “counter” metrics is variance. You can’t control OS and how it schedules the execution time for different processes. If you run a test ten times, you will probably get ten different results. With GC.CollectionCount, you should get a stable value. Let’s consider an example:var gcBefore = GC.CollectionCount(0);var stopwatch = Stopwatch.StartNew();// Dummy code with huge number of allocationsint count = 0;for (int i = 0; i < 10000000; i++)count += new byte[1000].Length;Console.WriteLine(count);stopwatch.Stop();var gcAfter = GC.CollectionCount(0);Console.WriteLine($"Time: {stopwatch.ElapsedMilliseconds}ms");Console.WriteLine($"GC0: {gcAfter - gcBefore}");
Wall-Clock Time and GC.CollectionCount Metrics
Run | 1 | 2 | 3 | 4 | 5 |
|---|---|---|---|---|---|
Time | 6590ms | 6509ms | 6241ms | 7312ms | 6835ms |
GC0 | 16263 | 16263 | 16263 | 16263 | 16263 |
Remark. Of course, GC.CollectionCount has limitations. If you are working with a nondeterministic multithreaded algorithm, you can get different values even for GC.CollectionCount. But this value will be still more “stable” than the pure wall-clock time. If an algorithm is allocation-free , this metric is useless because it’s always zero.31
Iteration Subspace
Single iteration
This is the most popular and simple case: we always do exactly one iteration of a test. On the one hand, it’s great because it’s a very simple situation: we have only one measurement per revision. Performance history looks simple as well; it’s just a function from a commit to a single number (for each metric). On the other hand, we have limited data: we don’t know any information about the performance distribution for the test. Imagine that you have the following measurements for two subsequential commits: 50 ms and 60 ms. Do we have a problem? You can’t say anything about it because you don’t know the distribution.
Many iterations
If you do many iterations, you have much more data! On the one hand, that’s great because you can run many cool analyses. On the other hand, now you kind of have to do these analyses. Additional iterations are not free: you pay for them with time and machine resources. If you decide to do many iterations, you should understand how you are going to use this data (it also helps you to choose the best number of iterations). For example, it allows comparing commits. If you have a (50ms) vs. (60ms) situation, you can’t say for sure that there is a performance degradation here. If you have a (50ms;51ms;49ms;50ms;52ms) vs. (60ms;63ms;61ms;49ms;61ms) situation, you can say that it’s most likely a degradation. If you have a (50ms;65ms;56ms;61ms;58ms) vs. (60ms;48ms;64ms;53ms;50ms) situation, you can say that most likely nothing is changed .
Test Subspace
Whole test
This is probably the most common way. You write a test that measures only one target case. Such testing may require a preparation (e.g., you should set an initial state up and warm the target logic up), but one test measures only one thing.
Test stage
In some cases, an honest test separation can be expensive. Imagine that you have a huge desktop application and you want to measure the “shutdown” time: the interval between a moment when a user clicks the close button and the moment when the application process is finished. Such tests require a lot of preparatory work. For example, you can spend 5 minutes for initialization (emulation of active work in the application) and only 1.5 seconds on the shutdown logic. If we perform 12 iterations inside the test, the whole test will take more than 1 hour. A whole hour of testing for a single test that takes 1.5 seconds! That looks like a waste of our time and machine resources.
Unfortunately, we can’t significantly improve the situation for the shutdown test. However, we can something else: we can use these 5 initialization minutes to our advantage! In fact, we have an integration test that takes a lot of time and performs a lot of different operations. Let’s introduce “test stages” and measure each test separately. We can measure the application load time and duration of some typical operations in the same tests. On the one hand, this move looks dirty and breaks the rules of classic unit testing: instead of measuring each feature in a separate test, we measure all kinds of different stuff in the same test. On the other hand, we have no choice (don’t hate the player; hate the game!). Tests should be fast. In the case of performance tests, it’s impossible to run them really fast, but the whole performance testing suite should take a reasonable amount of time. Test stage is a powerful technique that can save you a lot of time.
Test suite
When we analyze many tests together, we can do a lot of additional analysis. It’s very important to perform a correlation analysis. For example, if you have a performance degradation after some changes, it’s useful to find the whole scope of tests that have this degradation .
Environment Subspace
Spatial clustering
When you have metrics for the same test from several agent, you can try to find factors that affect performance. It can be the operating system, the processor model, or any other parameter of your environment.
Temporal anomalies
If you are investigating the performance history of a single test, it can be useful to compare durations of the test runs on different CI agents. If a performance degradation or another anomaly appeared at that moment when the CI agent was changed, the first thing that you should check is the difference between the CI agent environments .
Parameter Subspace
Nontrivial dependencies
Let’s say that we have a test that processes many requests. The requests can be processed in several threads. How does the performance depend on the degree of parallelization? You may get a 2x performance boost when a single-thread implementation is replaced by a two-thread solution. However, switching from four threads to eight may slow down the benchmark because of inefficient and heavy locking. You can find the best parallelization degree only if you check several possible values.
Asymptotic complexity
Let’s say that we have a test that checks whether a given string of length M is contained in a text of length N. The time complexity depends on the underlying algorithm. For example, it can be O(N · M) for a trivial implementation or O(N + M) for a smarter algorithm. You can easily miss some important degradation if the test works only for short search patterns and doesn’t check the larger cases. The knowledge of the complexity allows you to extrapolate results on huge inputs without actually having to test them.
Corner cases
Let’s say that we have a test with the quicksort algorithm . In the best and average case, the complexity is O(N · log N), but it becomes O(N2) in the worst case. The knowledge of the worst-case performance also may be very important (especially if we have a risk on a performance attack on the program). The worst possible performance is another valuable metric that we can collect during testing.
Duration range
Let’s say that we have a test that parses text with a regular expression. In this case, the test duration may vary in a huge range depending on the expression complexity and the text. It’s not enough to just check a few input cases to get reliable performance metrics. Good performance coverage for such a test requires hundreds of inputs that correspond to different real-life situations and corner cases. Speaking of corner cases: there are regular expression denial of service (ReDoS) attacks that can significantly slow down your code. One of the most famous .NET Framework 4.5 ReDoS exploits against MVC web applications is described in [Malerisch 2015]: the EmailAddressAttribute, PhoneAttribute, UrlAttribute classes contained regular expressions that can be forced to calculate an exponential number of states on special inputs. The vulnerability was fixed in Microsoft Security Bulletin MS15-101.32 As you can see, the subspaces can be analyzed together: here we have an interesting performance issue that involves the environment and performance subspaces .
The parameter subspace analysis is very complex because you usually can’t check all possible inputs. However, you still should try to cover different cases for the same method. The benchmark metrics for a single test of input parameters can’t be extrapolated to the method performance in general.
History Subspace
History moment (single revision)
If you only have a single revision, you can look for spatial anomalies: there are plenty of them. You can’t find any performance degradations here, but you still can find a lot of problems that can be critical for your production environment.
Linear history (single branch)
If you have several revisions, you can look for spatial anomalies like degradation/acceleration. If you find a problem that is introduced in the latest release, you can bisect the history and find a commit with relevant changes.
Treelike history (selected branches or whole repository)
Sometimes, it makes sense to analyze several branches or even the whole repository. The number of performance measurements are always limited. If you are looking for anomalies like “Huge variance” or “Huge outliers,” you can join performance history of the master branch and all feature branches. Analysis of this “mixed” history can produce a lot of false positive results, but it usually easily finds serious problems that are hard to detect based on a single branch because you don’t have enough measurements .
Summing Up
The performance space contains many subspaces like the metric subspace, the iteration subspace, the test subspace, the environment subspace, the parameter subspace, the history subspace, and others. Each of these subspaces or their combination can have a significant impact on performance. The knowledge of the situation in a few points of the whole space doesn’t allow extrapolating these results in general. Understanding the performance space helps you to perform high-quality performance investigation: you can discover more anomalies and find the factors that affect performance. Of course, it’s not possible to carefully check the whole space: there are just too many possible combinations. The rich investigation experience will help you to guess factors that most likely affect the performance. You may also find interesting ideas in other people’s stories: they increase your erudition and improve your performance intuition.
Performance Asserts and Alarms
One of the biggest challenges in performance testing is automated problem detection. When you do a regular local performance investigation, it’s not always easy to say if you have a performance problem or not. The performance space can be really complicated, and it takes time to collect all relevant metrics and analyze them. In the world of performance testing, you have to automate this decision. There are two main kinds of such decisions, which can be expressed as performance asserts and performance alarms.
When a performance assert is triggered, we’re sure that something is wrong with the performance. Asserts can be effectively applied to processes with 100% automation like the precommit testing. If a performance assert fails, it means that the corresponding test is red. Thus, it should have a low Type I (false positive) error rate. Unfortunately, it’s almost impossible to get rid of errors completely, but the errors should be quite rare (otherwise, we get flaky tests).
When a performance alarm is triggered, we are not sure that something is wrong; the situation requires a manual investigation. Alarms can be effectively applied to situations when a performance plot looks “suspicious.” Such alarms can be aggregated into a single dashboard, which is processed by developers on a regular basis. It’s a typical situation when you have several false alarms per day because this doesn’t interfere with the development process. Usually, it doesn’t take a lot of time to check out such alarms and make a decision that we have nothing to worry about. Meanwhile, some serious problems can be detected in time with this approach, which reduces Type II (false negative) errors. Alarms work well for anomalies like clustering or huge variance: in these cases, we can’t afford to have a red test for all such anomalies. Moreover, if a test has a huge variance, it’s hard to write a strict performance degradation assert with a small false positive rate. An alarm can solve this problem: you can get a few notifications per week for no good reason,33 but you will also be notified when someone spoils the performance for real. The alarm approach is also useful for trade-off situations when we sacrifice performance in one place for some benefits in other areas. In such cases, developers definitely should be notified about it (in many cases, changes are made unintentionally), but the situation should be resolved manually.
Absolute threshold : a hardcoded value in the source code (like 2 seconds or 5 minutes)
Relative threshold : a hardcoded ratio to a reference value (like 2 times faster than another method)
Adaptive threshold : comparing current performance with the history without hardcoded values (like it shouldn’t be slower than yesterday)
Manual threshold : a special developer who watches the performance plots all the time and who is looking for problems
Let’s discuss each kind of threshold in detail.
Absolute Threshold
NUnit, MSTest: both frameworks provide [Timeout] attributes, which all allow you to set timeout in milliseconds.
xUnit: As of xUnit 2.0 (and in subsequent versions like 2.1, 2.2, 2.3), the framework doesn’t support timeouts34 because it’s pretty hard to achieve stable time measurements with parallelization enabled by default in xUnit 2.x. Thus, you have to implement the timeouts manually like in the preceding example. In this case, it’s highly recommended to disable parallelization.
Simple implementation
You can implement it with a few lines of code. In case of NUnit or MSTest, a single [Timeout] attribute is usually enough. In case of xUnit or a complicated check, you need two lines with Stopwatch (Start/Stop) and a single line with assert.
Portability
Not all computers are equally fast. A test can satisfy a 2000ms timeout on your machine in 100% runs, but it can fail on a slow machine of your colleague or in a virtual environment on a CI server.
Flakiness
When a timeout is close to actual test duration, the test can be red sometimes depending on the duration variance and other resource-consuming processes in OS, which can slow down this test.
Maintainability
When I see a test with a hardcoded absolute timeout, I always look at the test history. Typically, it looks like in Table 5-16. You can see that developers change the hardcoded value in the source code all the time. This is not a healthy thing. If such commits are a common practice in your team, it’s always easier to increase the timeout of a red test instead of doing an investigation in case of real performance problems .
Example of Absolute Timeout History
Revision | Timeout | Comment |
|---|---|---|
N | 5000 | Increased timeout because test works too slow on my machine |
N-1 | 3000 | Test timeout adjustments |
N-2 | 7000 | Some new CI agents are too slow; increase timeouts |
N-3 | 4562 | Decrease timeouts to minimum possible values |
N-4 | 5000 | Test is flaky, it’s red in 3% cases on CI; increase timeout |
… | … | … |
Test is hanged because of a deadlock. The timeout helped us to save time on a CI agent.
Test takes 1.5 minutes instead of a few seconds because of a bug. Hooray, performance asserts helped to find a performance degradation.
The variance is huge, a test takes from 1 second to 5 minutes (probably because of the moon phase). Typically, this means a serious bug in the source code; such anomalies should be investigated.
If you want to use accurate absolute timeouts (like 5 seconds in our example), you probably should use alarms instead of asserts. For example, you can manually check all tests that have several alarms per week. This isn’t a perfect solution, but the implementation is really simple (if you already have an “alarm infrastructure”).
If you don’t like the idea of absolute timeouts, there are other ways to implement performance tests. Let’s talk about relative thresholds.
Relative Threshold
Relative method performance
You can introduce a Baseline and measure the relative performance of all methods to the baseline. When you are marking changes in the source code, you can calculate relative performance against the baseline instead of analyzing the absolute numbers.
Relative machine or environment performance
The baseline approach can also be used for comparing performance between different machines.35 The same trick can be used to compare performance between several runtimes on the same hardware. For example, Mono and .NET Core have different startup time overheads. In theory, the relative threshold is not a correct approach because the performance ratio between different methods can be different for each machine/environment. In practice , this approach usually works for most simple cases.
Handling portability issues
You should understand that this is not the perfect solution, but it usually works pretty well for simple cases.
Flakiness
The same as in the absolute threshold case: sometimes you will get false alarms.
Maintainability
Relative thresholds are still hardcoded; you should manually change it in case of important changes like changes in the test .
Adaptive Threshold
No hardcoded values
You shouldn’t keep many magic numbers in the source code anymore. You even shouldn’t think about how fast the code should be. An algorithm will check automatically that you don’t have any performance degradations or other anomalies.
Slow reaction to changes in the test
If you change the logic of the test (for example, add a few heavy asserts), you should retrain your algorithm and wait while the algorithm “learns” the new baseline. Meanwhile, you will get false alerts. Of course, you can introduce a way to mark a test as “changed” or clear the performance history, but it’s usually not as simple as changing a hardcoded threshold.
Smart algorithm is required
You should manually implement an algorithm that compares the performance history and the current state. Unfortunately, no universal algorithm solves this problem in general or works for all projects. There are some ready solutions, but you should check which one works for you. Don’t forget about possible pitfalls like the optional stopping problem (which we discussed in Chapter 4).
Manual Threshold
When we discussed the strategies of defense against performance anomalies , the last one was the manual testing. If we can’t cover tests by performance asserts, we always can generate performance alarms. It’s not easy to detect all “suspicious” tests because this requires a threshold. However, you can easily generate “worst of the worst” tests.
For example, let’s imagine that we are looking for tests with huge variance but we can’t say when the variance is huge. Let’s calculate the variance for each test and sort the results. We can generate the “Top 10” tests with the biggest variances each day. Performance plots for these ten worst tests should be checked manually, and a developer should decide the following for each test: do we have a problem here or not? I call this the “dashboard-oriented approach.”
Another example: we are looking for performance degradation but we can’t say when we really have a degradation. Let’s calculate the difference between average performances from this week and the previous week. Yes, I know that the average is an awful metric and the distribution can be too complicated. But if something really bad happens with the test, you typically will see it in the “worst of the worst” tests. We call it “manual threshold” because a developer should manually check a test in order to say “It doesn’t look like a normal test to me.”
This approach is not accurate, and it requires manual checking of these reports every day. However, it can help discover some performance anomalies that were not caught by performance asserts. Since we don’t have real performance asserts here, the final Type I (false positive) error rate is zero. The Type II (false negative) error rate is reduced because you can find some missed problems. Of course, the reduction is not free; you pay for it with the working time of your team members.
Handle even supertricky cases
You can detect very tricky problems that are almost impossible to cover by a smart algorithm. Typically, an experienced developer can instantly say if you have a performance problem or not with a quick glance at the performance plot.
Complete lack of automation
You should manually check most suspicious tests every day.
Summing Up
If you want to implement a reliable system that helps you to handle all kinds of performance problems, you need both performance asserts and alarms. Asserts helps you to automatically prevent degradations before the changes are merged with a high confidence. Alarms help you to monitor the whole test suite and notify you about problems that cannot be detected with a low false positive rate.
You can use different kinds of thresholds in both cases. Absolute thresholds are the simplest way to implement it, which is good for a start, but it’s not a reliable way in the longer term: this approach has a lot of issues with portability, flakiness, and maintainability. Relative threshold is better: it solves some of the issues, but not all of them. Adaptive thresholds are great, but it’s not easy to implement them, and you should carefully handle cases when you change the test performance on purpose. Manual threshold is also an effective technique that helps you to find problems not currently covered by automatic thresholds, but it requires a special performance engineer who systematically monitors performance charts.
There is no single universal approach that will be great for all kinds of projects. However, combinations of different approaches for performance asserts and alarms can protect you even from very tricky and nonobvious performance problems.
Performance-Driven Development (PDD)
Define a task and performance goals
Write a performance test
Change the code
Check the new performance space
In this section, we discuss this approach in detail: how it should be used and how useful it can be in daily performance routine. The PDD is not a solution for all kinds of situations, but this concept can be useful when you want to minimize the risk of introducing performance issues.
Define a Task and Performance Goals
Codename: “Optimizations”
Task: Optimize ineffective code
Goal: We should achieve “better” performance
It’s not a good idea to blindly optimize different parts of your code. A performance test can help you to verify that you actually optimized something and evaluate the performance boost.
Codename: “Feature”
Task: Implement a new feature
Goal: The feature should be fast
When a feature is already implemented, there is always a temptation to say something like “It seems that it works fast enough.” A proper performance test helps to set your business requirements in advance. This case is pretty similar to a situation in classic TDD.
Codename: “Refactoring”
Task: Refactoring in performance-sensitive code
Goal: We should keep the same level of performance (or make it better)
It’s pretty hard to say that you didn’t introduce any performance degradations if you don’t have a baseline. A baseline helps you to verify that everything is OK.
In each case, the task should correspond to your business goals. “Better performance,” “fast feature,” and “same level of performance” are abstract, ineffective terms. The PDD forces you to formalize the goal and specify the required metric values.
Write a Performance Test
This is the most important part of PDD. You shouldn’t do anything before you get a reliable performance test (or a test suite). “Optimizations” and “Feature” should be started with a red test; “Refactoring” should be started with a green test that can be easily transformed to a red one.
If you can’t write a performance test, something is going wrong. Usually, it means that you have problems with performance goals. For example, you want to optimize a method because it “looks ineffective.” In this case, you should prove that it’s ineffective by a red performance test. Your performance requirements should be strictly defined. If you can’t write a red test that corresponds to performance requirements, you probably don’t need optimizations because you can’t demonstrate that the method is ineffective.
Keep in mind that the test should be green at the end. If you made your optimizations, but the test is still red, you may be tempted to change performance asserts. Be careful: it’s a slippery slope! Indeed, sometimes you collect new information, and you have to change something in the test. In this case, you also have to check that the test is still red before the optimizations. PDD assumes that an optimization is always a transition from a red performance test to a green one. There are many cases when you can’t achieve such transition. And it’s the coolest “feature” of PDD: it protects you from premature or wrong optimizations!
Step 1: Write target method
Just write a method that covers the target case. Imagine that you are writing a functional test that covers your code. As in the case of ordinary tests, you should try to isolate logic and measure only logic that matters to you. In the “Optimizations” case, you should cover only logic that you are going to optimize and nothing else. In the “Feature” case, you should cover the feature (and only the feature) in advance (as you usually do in typical TDD). In the “Refactoring” case, you should cover only the performance-critical part of the architecture that you are going to refactor. It’s always better to have several performance tests. If you came up only with a single one, try to parametrize it. If you read a file, try files with different sizes. If you process a dataset, try different datasets.
Step 2: Collect metrics
As a minimum, you have to measure raw test duration. However, it’s better to collect some additional metrics like hardware counters, GC collections, and so on. Do many iterations, accumulate them, and calculate statistics numbers. Run tests not only on your developer machine but also on machines of your colleagues and on a server.
Step 3: Look at the performance space
It’s not enough to just collect raw metrics; you should carefully look at them. Check out how the distribution looks. Does it have one mode or several modes? What about the variance? How does the performance depend on the test parameters? Is the dependency linear or not? What’s the maximum parameter value that produces a reasonable duration for the performance test? If you practice PDD on a regular basis, you will come up with your own checklist soon. Looking at the performance space doesn’t require too much time (especially if it’s not your first time), but it can save a lot of time later. Knowledge about some “features” of the test performance space will help you to find tricky places in your source code that you should be aware of.
Step 4: Write performance asserts
Now it’s time to transform your business goals into performance asserts. Remember that the test should be red for “Optimizations” cases. Many developers skip this step. You may be tempted to say: “OK, I know how much time it takes now. I can optimize my code and check how much it takes after that. Next, I will write performance asserts.” This is a bad practice: it can destroy your business goal. If you want to optimize a method twice, write a corresponding assert. If you discover new things during optimizations (like “Hey, I can optimize it ten times!” or “It’s just impossible to optimize more than 50%”), you always can change the assert later. But you still have to express your original intention in the form of performance asserts. I have seen many times when developers say something like “After these crazy hacks I get 5% speedup, now I’m going to commit it” (whereas 5% speedup doesn’t have business value and crazy hacks mutilate the code and move it to the “impossible to maintain” state). Original performance asserts don’t protect you from all such cases, but they will make you think twice before committing code that doesn’t solve the original problem.
Step 5: Play with the test status
Next, you should check that you wrote good performance asserts. In the “Optimizations” case, try to transform the red test to a green one by commenting the “heaviest” part of your code. In the “Refactoring” case, try to add a few Thread.Sleep calls here and there and make sure that the test is red now. In the “Feature” case, check empty and Thread.Sleep implementations. You should be sure that you wrote performance asserts correctly (at the end, tests should be green in case of success or red in case of failure).
Once you have a good performance test with correct performance asserts and you learned what the performance space looks like, it will be time to write some real code!
Change the Code
Now it’s time to remember your original goals and optimize the product, implement new features, or perform refactoring. You can be completely focused on your task without fearing to introduce a performance problem.
The classic TDD approach assumes that you should write a code that makes your test red. It can be useful for PDD as well. For example, if you are developing a feature, you can write a naive implementation first. Such implementation should work correctly, but it can be slow. You should get a situation with green functional/integration/unit tests and red performance tests. After that, you can start to optimize the code until you reach your original performance goals. It should be very easy to verify it with one click because you have the performance tests.
Check the New Performance Space
Remember that it’s not always possible to cover all possible problems by automatic performance asserts. So, it’s nice to check the part of the performance space that can be affected by your changes.
Here is another example from my personal experience. Rider on Unix uses Mono as a runtime for the ReSharper process. Each version of Rider is based on a fixed bundled version of the Mono runtime. Sometimes, we have to upgrade Mono to the next stable release. We never know how this upgrade can affect the Rider performance. We have a lot of tests, but it’s almost impossible to cover all cases in a huge product that can be affected by changes in the runtime. So, we create two revisions with the same Rider code base and different versions of Mono. After that, we do several dozen runs of the whole test suite on the same hardware and different operating systems (Windows, Linux, macOS). Next, we build dashboards for different metrics that have the biggest differences between revisions. Next, I start to manually check the top tests in these dashboards and look at their performance plots. My favorite metric is variance: we have found plenty of problems by looking at tests that have huge differences between variance for old and new versions of Mono. Unfortunately, it’s almost impossible to automate this process because the high Type I (false positive) error rate. However, sometimes, in perhaps 1 test out of 100, we find very serious problems that actually affect the product.
Summing Up
PDD is a powerful technique that provides a reliable way to do performance-sensitive tasks. It allows you to control performance of your code during development and prevent many bugs and degradations in advance. Also, it forces you to formalize your performance goals and write many performance tests.
However, this approach also has one important disadvantage: it creates an immense amount of work, most of which is likely extraneous for most projects and most types of code. While TDD can be used on daily basis, it’s not recommended to use PDD all the time. You should be sure that the benefits from PDD (decreased risk of introduced performance problems) are worth the time and resources that you spend on writing performance tests in advance.
Performance Culture
Shared performance goals: all team members should have the same performance goals.
Reliable performance testing infrastructure: infrastructure should work great, and developers should trust it.
Performance cleanness: you shouldn’t be tolerant to performance problems and your list of unexamined performance anomalies should be empty.
Personal responsibility: each developer is responsible for the performance of his or her code.
As usual, let’s start with the performance goals.
Shared Performance Goals
All team members should share common performance goals. They should clearly understand it. It doesn’t matter what kind of goals do you have.
It’s OK if you don’t care about performance at all if all team members don’t care about performance. It can be applied not only to performance but to every business goal. It’s hard to work with the same team on the same product with people who don’t share goals with you. Such situations produce many communication problems and spoil the business process.
If a decent performance level is your business goal, it should be obvious for all developers in the team. Remember that when we say “good performance,” this isn’t the best wording. The target performance level should be formalized and expressed with some metric. In this book, there are many chapters that explain again and again why it’s so important to formalize your goals. There is a reason for that. There are many situations when a performance engineer speaks with another team member and says something like “We have a performance degradation after your recent changes: could you please fix it?” If he or she gets an answer like “I’m too busy, I am not going to fix it, it works fast enough,” we can’t say whether it make sense to fix the problem or not because we don’t know the performance goals of this team. Moreover, there are no unified business goals in the team that are clear for everyone.
If such a situation exists, you have to formalize goals. For example, you can say that a web server should process at least 1000 RPS. Or you can say that any operation on the UI thread shouldn’t take more than 200 ms.
It’s worth noting that some teams can live without strict formalized performance goals. I have seen many cases in which a team has an empirical understanding of the goals. If you can work without conflict over performance and still achieve your goals, that’s great; keep up the good work!36
It doesn’t matter what kind of goals you have and how you express them, as long as all team members agree with them.
In [Duffy 2016] (see the “Management: More Carrots, Fewer Sticks” section therein), Joe Duffy said: “In every team with a poor performance culture, it’s management’s fault. Period. End of conversation.” That’s a controversial statement, but it seems to be true for most teams . Originally, performance culture was an approach to help you achieve performance goals. However, if you really care about performance, the performance culture should become one of the goals for management. It’s not something that you can get for free: a performance culture requires hard work and many conversations with your team members. All of them should have common values and views, and management should make some investment in it. Here is another quote from the post: “Magical things happen when the whole team is obsessed about performance.”
Reliable Performance Testing Infrastructure
All tests should be green
If you constantly have some red or flaky tests, nobody will care about “one more test” with some performance problems.
Type I (false positive) error rate should be low
If you get false alarms about performance problems all the time, you will probably start to ignore them because you will spend your time on the investigation without any benefits from it.
It should be easy to write a performance test
Writing performance tests is usually an optional task. If such tests require complicated routine work, developers will be tempted to skip it.
If you want to force developers to use a tool (e.g., a performance testing infrastructure), it should be reliable and easy to use. The developers should trust the tool and enjoy using it. Otherwise, it will not work.
Performance Cleanness
If a window in a building is broken and is left unrepaired, all the rest of the windows will soon be broken.
This rule can also be applied to software development. If you have many performance problems here and there, or if you have a lot of tests with suspicious anomalies without an assignee, you will get new performance problems all the time.
Zero tolerance for performance problems
If you have a new performance problem, it should be investigated on the spot. Try to forget about backlog lists and thoughts like “I’m too busy right now, will take a look at the next week.” It will be much harder to investigate the issue a week later: other problems can be introduced and “the rest of the windows will soon be broken.” Of course, it’s ideal when you instantly fix any performance problems. In many cases, though, this can be impossible because you have many other higher-priority issues that can’t be postponed. But, in terms of zero tolerance for performance problems, it doesn’t matter that you can’t always achieve this ideal situation.37
Regular checking of the performance anomaly list
I should say it again: it’s pretty hard to catch all problems automatically. New problems that are not covered by performance tests with strict asserts can be introduced at any moment. Thus, it’s a very good practice to have some performance alarms and dashboards and to check them regularly.
Of course, these rules are valid only for projects with corresponding business goals. The performance cleanness can significantly simplify keeping a decent level of performance. Once you achieve the cleanness, it’s much easier to support it than trying to find the most important issues in the midst of “performance chaos.”
Personal Responsibility
Performance cleanness is the responsibility of each developer. In many teams, there are a few developers who know a lot about performance and everyone thinks that they should handle all the performance problems. Why?
Let’s say you are going to commit a new feature. If you want to have clean code in your repository, you are responsible for your code. Imagine that there is a developer who is responsible for the clean code: you commit dirty code, and this developer will clean this code for you: make basic formatting, choose proper names for variables, and so on. But this sounds ridiculous, right? No developer will fix your code style for you.
Why is it a common practice to have a performance geek who should solve all the performance problems? It’s good to have someone who knows a lot about performance and optimization and can help you with a tricky situation. But he or she shouldn’t do all tasks.
You should care about the performance of your code. You should care about performance cleanness. It’s your personal responsibility .
Summing Up
If I had to choose between a team of developers who have strong performance skills and a team of developers who have strong performance culture, I would choose the second team. If developers have the performance culture, they can read books and blog posts about performance, optimizations, and runtime internals, they can learn how to use tools for profiling and benchmarking, and they can adopt some good practices and techniques. Without the performance culture, their performance skills will probably not help to develop a product with a small number of performance problems.
The shared performance goals help you to communicate with each other. A reliable performance testing infrastructure helps you to easily solve routine technical tasks. The performance cleanness helps you maintain the product without any “broken windows.” Personal responsibility helps to make the code of each developer better and faster. All these things together help you to get the performance culture in your team and develop awesome, fast, and reliable software.
Summary
Performance testing goals
The basic goals are to prevent performance degradations, detect not-prevented degradations, detect other kinds of performance problems, reduce Type I (false positive) and Type II (false negative) error rates, and automate everything. You can also have your own goals, but you still have to remember these primary goals, which are relevant for most projects.
Kinds of benchmarks and performance tests
There are many of them like cold start tests, warmed-up tests, asymptotic tests, latency and throughput tests, user interface tests, unit and integration tests, monitoring and telemetry, tests with external dependencies, stress/load tests, user interface tests, fuzzing tests, and so on. A good performance test suite usually includes a combination of these kinds.
Performance anomalies
Degradation is not the only performance problem that you can have. There are many other anomalies like acceleration; temporal and spatial clustering; huge duration, variance, outliers; and multimodal distributions. If you want to get rid of all performance problems, you should systematically check out your test suite. Probably, you will get many false anomalies, but it’s still worth it to monitor your anomalies.
Strategies of defense
There are many strategies of defense against performance problems. Here are some of them: precommit tests, daily tests, retrospective analysis, checkpoint testing, prerelease testing, manual testing, postrelease telemetry and monitoring. As usual, it makes sense to use a combination of some or all of these approaches.
Performance space
In most performance investigations, we work with a multidimensional performance space that contains many subspaces like metric subspace, iteration subspace, test subspace, CI agent subspace, environment subspace, and history subspace. Understanding these subspaces allows collecting more data for the investigation and finding the factors that actually affect performance.
Performance asserts and alarms
Performance asserts are automatic checks used in performance tests with a low false positive rate. Performance alarms are notifications about performance problems that can’t be used directly as an assert because of a high false positive rate. Both asserts and alarms can use different kinds of thresholds: absolute, relative, adaptive, and manual.
PDD
This technique is similar to classic TDD with performance tests instead of the usual unit/functional/integration tests. It helps you to optimize the product, implement new features, or perform refactoring with confidence that you will not spoil the performance (or that you will make it even better).
Performance culture
Performance testing is not only about technologies, it’s also about attitude. The key components of the performance culture are shared performance goals, good management, reliable performance testing infrastructure, performance cleanness, and personal responsibility. The performance culture is required if you want to make performance testing work.
Of course, it’s not possible to cover all aspects of performance testing in a single chapter. However, we discussed some of the most important techniques and ideas that will help you to improve your investigator skills and start to cover your product with performance tests.
References
[Akinshin 2018] Akinshin, Andrey. 2018. “A Story About Slow NuGet Package Browsing.” May 8. https://aakinshin.net/blog/post/nuget-package-browsing/ .
[AnomalyIo 2015] “Anomaly Detection Using K-Means Clustering.” 2015. Anomaly.io. June 30. https://anomaly.io/anomaly-detection-clustering/ .
[AnomalyIo 2017] “Detect Anomalies in Correlated Time Series.” 2017. Anomaly.io. January 25. https://anomaly.io/detect-anomalies-in-correlated-time-series/ .
[Bragg 2017] Bragg, Gareth. 2017. “How We Took Test Cycle Time from 24 Hours to 20 Minutes.” October 12. https://medium.com/ingeniouslysimple/how-we-took-test-cycle-time-from-24-hours-to-20-minutes-e847677d471b .
[Chua 2014] Chong, Freddy, Tat Chua, Ee-Peng Lim, and Bernardo A. Huberman. 2014. “Detecting Flow Anomalies in Distributed Systems.” In Data Mining (ICDM), 2014 Ieee International Conference, 100–109. IEEE. https://arxiv.org/abs/1407.6064 .
[Dimopoulos 2017] Dimopoulos, Giorgos, Pere Barlet-Ros, Constantine Dovrolis, and Ilias Leontiadis. 2017. “Detecting Network Performance Anomalies with Contextual Anomaly Detection.” In Measurement and Networking (M&N), 2017 IEEE International Workshop, 1–6. IEEE. doi: https://doi.org/10.1109/IWMN.2017.8078404 .
[Duffy 2016] Duffy, Joe. 2016. “Performance Culture.” April 10. http://joeduffyblog.com/2016/04/10/performance-culture/ .
[Ibidunmoye 2016] Ibidunmoye, Olumuyiwa, Thijs Metsch, and Erik Elmroth. 2016. “Real-Time Detection of Performance Anomalies for Cloud Services.” In Quality of Service (IWQoS), 2016 IEEE/ACM 24th International Symposium, 1–2. IEEE. doi: https://doi.org/10.1109/IWQoS.2016.7590412 .
[Kofman 2018] Kofman, Svetlana. 2018. “Incident Report - NuGet.org Downtime on March 22, 2018.” March 22. https://blog.nuget.org/20180322/Incident-Report-NuGet-org-downtime-March-22.html .
[Kondratyuk 2017] Kondratyuk, Dan. 2017. “How Changing ‘Localhost’ to ‘127.0.0.1’ Sped Up My Test Suite by 18x.” June 9. https://hackernoon.com/how-changing-localhost-to-127-0-0-1-sped-up-my-test-suite-by-1-800-8143ce770736 .
[Malerisch 2015] “Microsoft .NET MVC ReDoS (Denial of Service) Vulnerability - CVE-2015-2526 (MS15-101).” 2015. Malerisch.net. September 10. http://blog.malerisch.net/2015/09/net-mvc-redos-denial-of-service-vulnerability-cve-2015-2526.html .
[Peiris 2014] Peiris, Manjula, James H. Hill, Jorgen Thelin, Sergey Bykov, Gabriel Kliot, and Christian Konig. 2014. “PAD: Performance Anomaly Detection in Multi-Server Distributed Systems.” In Cloud Computing (Cloud), 2014 IEEE 7th International Conference, 769–776. IEEE. doi: https://doi.org/10.1109/CLOUD.2014.107 .
[Songkick 2012] “From 15 Hours to 15 Seconds: Reducing a Crushing Build Time.” 2012. Songkick. July 16. https://devblog.songkick.com/from-15-hours-to-15-seconds-reducing-a-crushing-build-time-4efac722fd33 .
[Warren 2018] Warren, Matt. 2018. “Fuzzing the .NET JIT Compiler.” October 28. http://mattwarren.org/2018/08/28/Fuzzing-the-.NET-JIT-Compiler/ .
[Wilson 1982] Wilson, James Q., and George L. Kelling. 1982. “The Police and Neighborhood Safety: Broken Windows.” Atlantic Monthly 127 (2): 29–38.